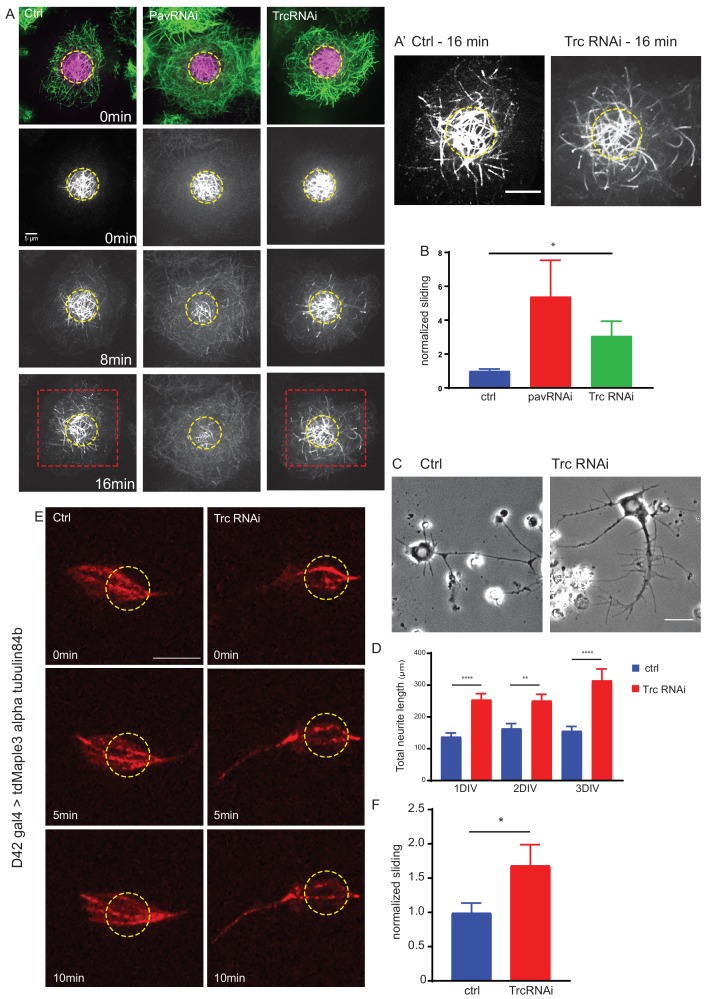
Figure 1. The kinase Trc regulates neurite outgrowth and microtubule sliding.
(A) Example images of timelapse imaging to measure microtubule sliding in Drosophila S2 cells. Microtubules are shown at time zero in green. Magenta indicates photoconverted region. Photoconverted region is highlighted by dotted yellow line at other timepoints. Red box indicates region shown in inset in A’ Scale bar 10 µm. (B) Quantification of microtubule sliding rate shows an increase upon Pavarotti or Trc depletion. n = 16–20 cells. Ctrl = 1.0 ± 0.1 upper 95% CI = 1.2, lower 95% CI = 0.8, Pav RNAi = 3.4 ± 1.0, 5.5, 1.4 Trc RNAi = 2.1 ± 0.4, 3.0, 1.2. Ctrl vs Trc RNAi p=0.03. (C) Representative images of 3rd instar larvae cultured neurons under control or elav > Trc RNAi conditions. (D) Quantification of total neurite length per cell over time in culture. The total neurite length is increased from control upon Trc depletion. 24 hr; ctrl = 137.8 ± 12.0 µm, Trc RNAi 254 ± 19.1 µm. p=0.0001. 48 hr; ctrl = 163.7 ± 15.3 µm, Trc RNAi = 251.2 ± 19.9 µm, p=0.001, 72 hr; ctrl = 156.3 ± 13.8 µm, TrcRNAi = 314.4 ± 36.5 µm, p=0.009. N = 11–23 cells from three independent experiments. (E) Example images from timelapse imaging of photoconverted microtubules in neurons under control conditions or upon Trc depletion. Tubulin was labeled with tdMaple3 alpha tubulin84b. After photoconversion, cells were imaged every minute for 10 min. Scale bar = 5 µm. (F) Quantification of microtubule sliding rates. Trc depletion leads to an increase in microtubule sliding rates in neurons. Ctrl = 1.0 ± 0.14, TrcRNAi = 1.69 ± 0.30. N = 20 cells from three independent experiments. p=0.04 Student’s T-test.


