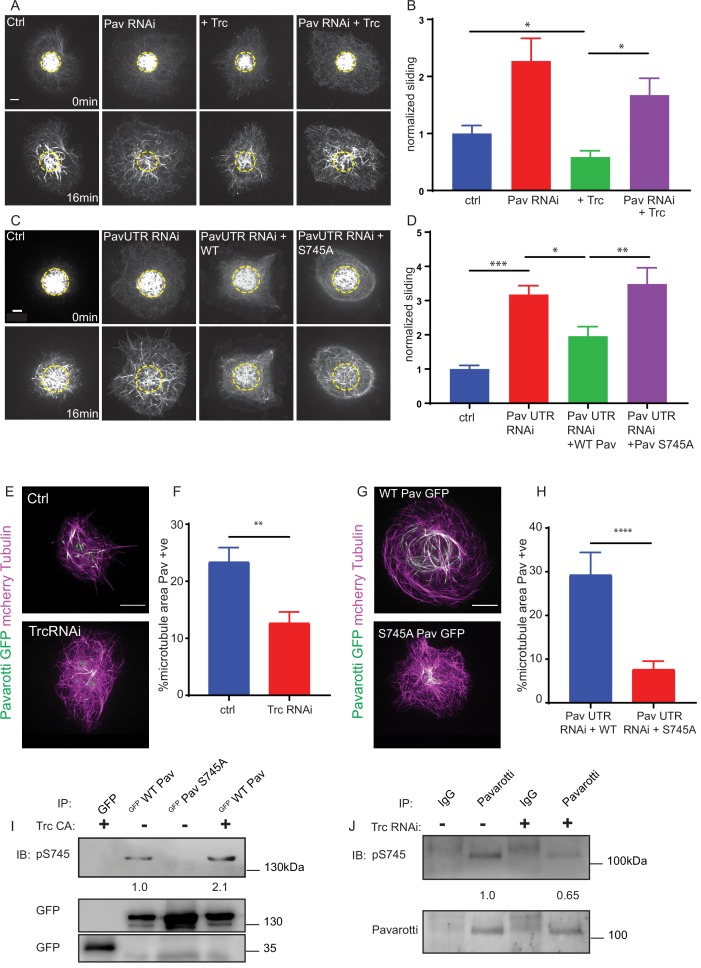
Figure 3. Trc regulates microtubule sliding via phosphorylation of Pavarotti.
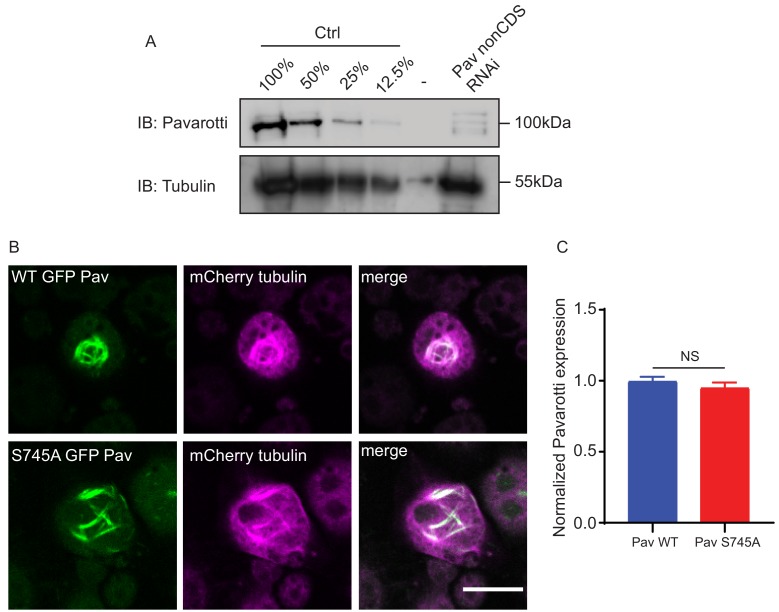
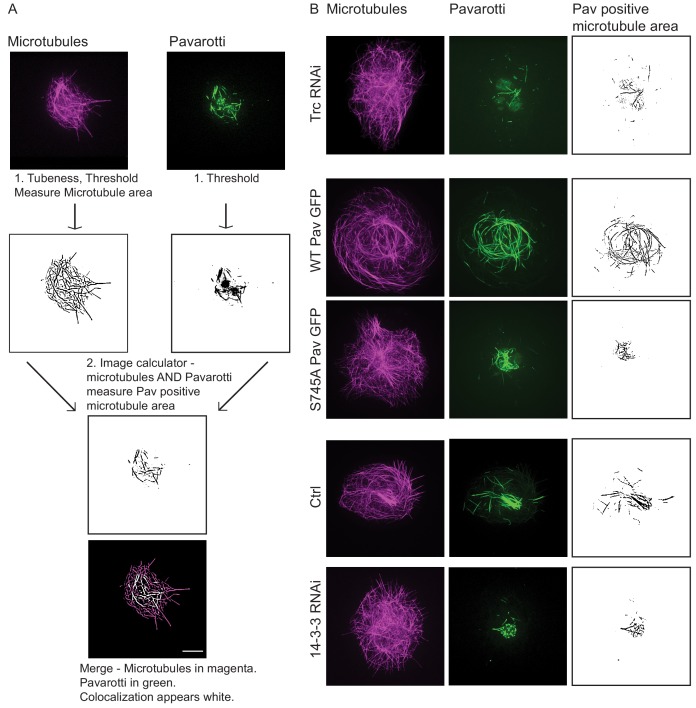
(A) Sliding experiments in S2 cells show a decrease in microtubule sliding with Trc overexpression. Trc overexpression in conjunction with depletion of Pavarotti increases sliding beyond control levels Scale bar 5 µm. (B) Quantification of sliding experiments in A. n = 27–41 cells per condition. Ctrl = 1.0 ± 0.11, Upper 95% CI = 1.2, Lower 95% CI = 0.8, Pav RNAi = 1.6 ± 0.25, 2.1, 1.0, Trc OE = 0.61 ± 0.0.8, 0.8, 0.44, Pav RNAi + Trc OE = 1.4 ± 0.22, 1.9, 0.9. Ctrl vs Trc OE p=0.04, Trc OE vs Pav RNAi + Trc OE p=0.003. One-way ANOVA with Sidak’s post-hoc test. (C) Sliding experiments in S2 cells show an increase in microtubule sliding with Pavarotti depletion. The effect can be rescued with WT Pavarotti but not with Phospho null mutant S745A. (D) Quantification of sliding experiments shown in C. n = 39–48 cells from 4 independent experiments. Ctrl = 1 ± 0.10 Upper 95% CI = 1.2, Lower 95% CI = 0.79, Pav RNAi = 3.16 ± 0.26, 2.65, 3.70, Pav RNAi + WT = 1.96 ± 0.28, 1.40, 2.52 Pav RNAi + Pav S745A = 3.49 ± 0.48, 2.53, 4.44. Ctrl vs Pav RNAi p=0.0001, Pav RNAi vs pav RNAi + WT p=0.04, Pav RNAi vs Pav RNAi + S745A p=0.94, Pav RNAi + WT vs Pav RNAi + S745A p=0.0025. One-way ANOVA with Sidak’s post hoc correction. (E) Example images of extracted S2 cells expressing mCherry Tubulin and WT Pavarotti GFP under control or Trc RNAi conditions. (F) Quantification of microtubule area colocalized with Pavarotti. n = 18–26 cells from three independent experiments. Ctrl = 23.5 ± 2.4%, Upper 95% CI = 28.6, Lower 95% CI = 18.3 Trc RNAi = 12.78 ± 1.9%, 16.62, 8.94. p=0.001 Student’s T-test Scale bar = 10 µm. (G) Example images of extracted S2 cells expressing mCherry Tubulin and WT Pavarotti GFP or Pavarotti S745A GFP. Endogenous Pavarotti was depleted with dsRNA targeting non-coding regions. (H) Quantification of microtubule area colocalized with Pavarotti. n = 12–17 cells from three independent experiments. Scale bar = 10 µm. WT = 29.4 ± 5.0%, Upper 95% CI = 40.4, Lower 95% CI = 18.4, S745A = 7.79 ± 1.8%, 11.5, 4.08. p=0.0001 Student’s T-test (I) Western blot of S745 phospho-Pavarotti from HEK cell lysates shows an increase in this species with Trc overexpression. (J) Western blot of immunoprecipitated Pavarotti prepared from dissected 3rd instar larvae brains shows a decrease in phospho Pavarotti at S745 upon depletion of Trc.


