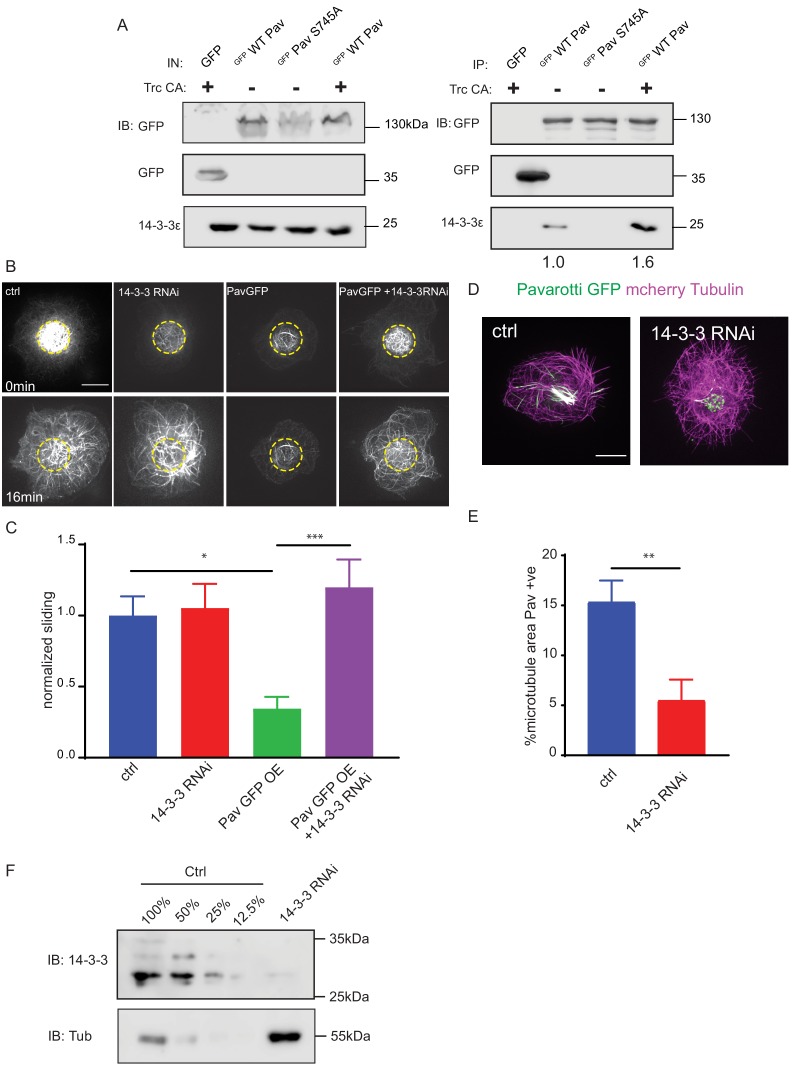
Figure 4. Phospho-Pavarotti brakes microtubule sliding via interaction with 14-3-3 proteins.
(A) Western blot from HEK cell lysate showing co immunoprecipitation of Pavarotti and 14-3-3. The interaction is lost upon mutation of S745 to Alanine and increased upon co-expression of the kinase Trc. (B) Sliding experiments in S2 cells show the ability of Pavarotti to brake microtubule sliding is dependent upon 14-3-3 proteins. Scale bar = 10µm. (C) Quantification of sliding experiments in B. n=21-26 cells from three independent experiments. Ctrl = 1 ± 0.14 Upper 95% CI = 1.28, Lower 95% CI = 0.72, PavOE = 0.35 ± 0.08, 0.52, 0.18 14-3-3 RNAi = 1.05 ± 0.17, 1.41, 0.70, 14-3-3RNAi + PavOE = 1.20 ± 0.20, 1.6, 0.8. ctrl vs pav OE p = 0.01, ctrl vs 1433RNAi p = 0.99, ctrl vs 1433 RNAi + PavOE p = 0.78, Pav OE vs 1433 RNAi p = 0.007, pav OE vs 1433 RNAi + Pav OE p = 0.0004, 1433 RNAi vs 1433 RNAi + Pav OE p = 0.91 One-way ANOVA with Tukey’s post-hoc correction. (D) Example images of extracted S2 cells expressing mCherry Tubulin and WT Pavarotti GFP. Depletion of 14-3-3s decreases microtubule area decorated with Pavarotti. Scale bar = 10µm (E). Quantification of microtubule area colocalized with Pavarotti. n = 22-26 cells from three independent experiments. Ctrl = 15.4 ± 2.1, Upper 95% CI = 19.72, Lower 95% CI = 11.07, 14-3-3 RNAi = 5.54 ± 2.0, 9.78, 1.30. p = 0.0017 Student’s T-test. (F) Western blot from S2 cell lysate demonstrating knockdown of 14-3-3.
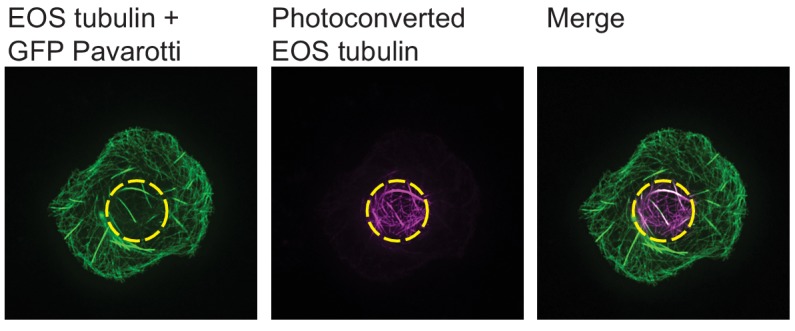
Figure 4—figure supplement 1. Confirming GFP Pavarotti expression.


