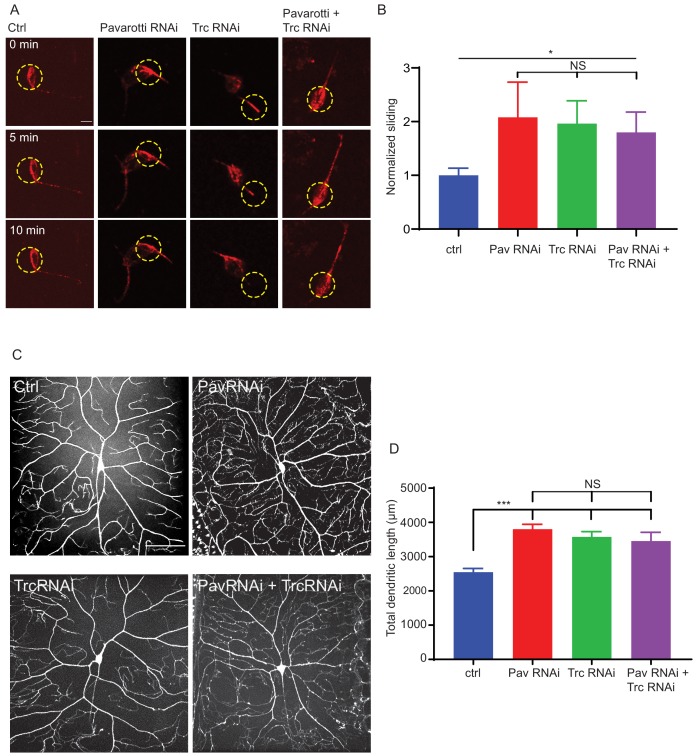
Figure 5. Pavarotti and Trc act in the same pathway to control dendrite outgrowth in vivo.
(A) Example images from timelapse imaging of photoconverted microtubules in neurons under control conditions or upon Pavarotti, Trc or Pavarotti and Trc depletion. Scale bar = 10 µm (B) Quantification of microtubule sliding rates. Ctrl = 1.0 ± 0.1, Upper 95% CI = 1.8, Lower 95% CI = 0.7, Pav RNAi = 2.1 ± 0.7, 3.5, 0.6, Trc RNAi = 2.0 ± 0.4, 2.8, 1.1, Pav and Trc RNAi = 1.8 ± 0.4, 2.6, 1.0. Ctrl vs Pav and Trc RNAi p = 0.014 Student’s T-test. (C) Example images showing DA neurons labeled with ppk::tdTomato in 3rd instar larvae under control conditions, with Pavarotti or Trc RNAi driven by elavGal4, or both RNAis together. Scale bar = 50 µm. n = 15–30 cells from at least 4 animals. Ctrl = 2549 ± 108 µm, Upper 95% CI = 2771, Lower 95% CI = 2328, Pav RNAi = 3803 ± 141 µm, 4099, 3507, Trc RNAi = 3577 ± 155 µm, 3904, 3250, Pav and Trc RNAi = 3455 ± 257 µm, 4005, 2905. (D) Pavarotti and Trc depletion cause an increase in dendritic length compared to control. Depletion of both proteins together has a non-additive effect compared with either RNAi. Ctrl vs Pav RNAi p<0.0001, Ctrl vs Trc RNAi, p<0.0001, Ctrl vs double RNAi p=0.0006, PavRNAi vs Trc RNAi p=0.76, Pav RNAi vs double RNAi p=0.48, Trc RNAi vs Double RNAi p=0.96. One-way ANOVA with Tukey’s post hoc correction.


