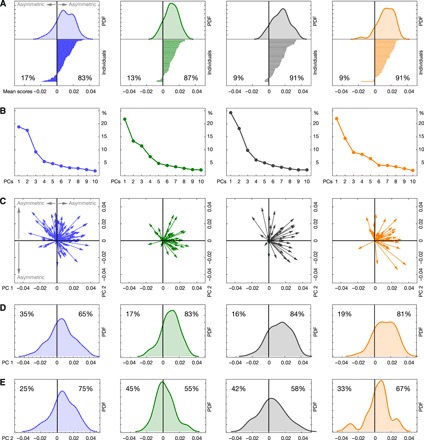
Fig. 4. Asymmetric shape variation within taxa.

(A) Taxon-specific mean asymmetry. The distribution of individual scores along this asymmetry pattern is shown on top (PDF, probability density function); the actual individual scores are shown below as lines. (B) Scree plots for taxon-specific principal component analyses of shape asymmetry display the portion of variance explained by PCs 1 to 10. (C) Taxon-specific principal component (PC) analyses of endocranial shape asymmetry. For each taxon, PC 1 versus PC 2 is shown. PC scores are shown as arrows, representing deviations from symmetry (which corresponds to the origin of the coordinate system). (D and E) Distribution of individuals along the first two taxon-specific PCs. Humans (n = 95) are shown in blue, chimpanzees (n = 47) in green, gorillas (n = 43) in black, and orangutans (n = 43) in orange.
