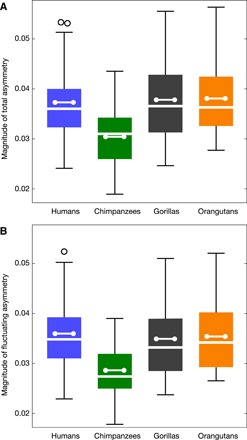
Fig. 5. Magnitude of shape asymmetry.

(A) Magnitude of total asymmetry (box-whisker plots by taxon). (B) Magnitude of fluctuating asymmetry (box-whisker plots by taxon). Humans (n = 95) are shown in blue, chimpanzees (n = 47) in green, gorillas (n = 43) in black, and orangutans (n = 43) in orange. Whiskers show the range (outliers as open circles), box and white line show the three quartiles, and the dumbbell represents the average.
