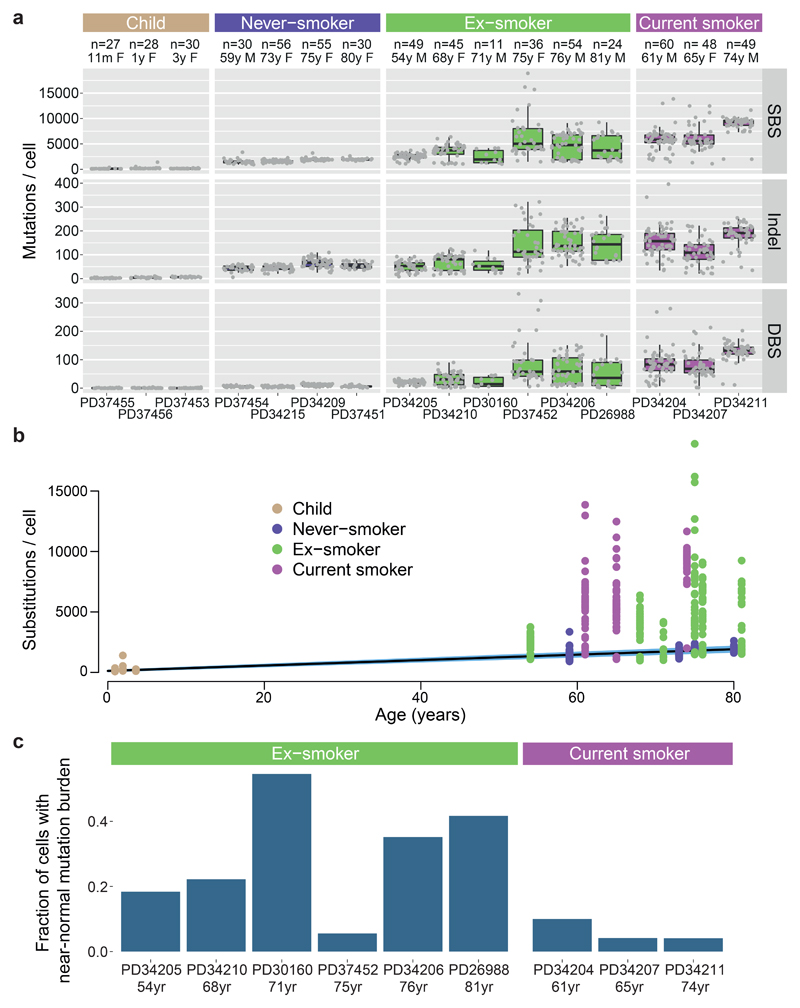
Figure 1. Mutation burden in normal bronchial epithelium.
(A) Burden of single base substitutions (SBS), small insertion-deletions (indels) and double base substitutions (DBS) across patients in the cohort. Box-and-whisker plots show each subject, with the boxes indicating median and interquartile range, and the whiskers denoting the range. The overlaid points are the observed mutation burden of individual colonies.
(B) Relationship of burden of substitutions per cell with age, with points representing individual colonies (n = 632), coloured by smoking status. The black line represents the fitted effect of age on substitution burden, estimated from linear mixed effects models after correction for smoking status and within-patient correlation structure. The blue shaded area represents the 95% confidence interval for the fitted line.
(C) Fraction of cells with near-normal mutation burden in current and ex-smokers.

