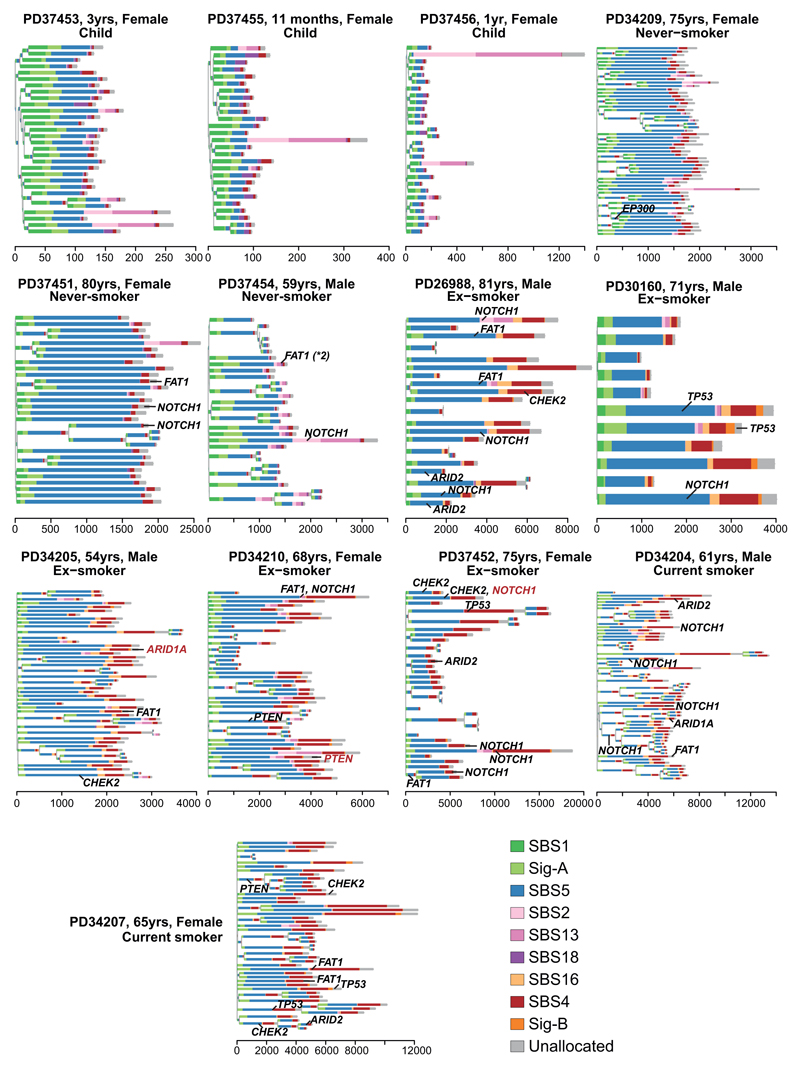
Extended Data Figure 6. Phylogenetic trees of 13 subjects.
Phylogenetic trees showing clonal relationships among normal bronchial cells in the 13 subjects not shown in Figure 3A. Branch lengths are proportional to the number of mutations (x axis) specific to that clone/subclone. Each branch is coloured by the proportion of mutations on that branch attributed to the various single base substitution signatures.

