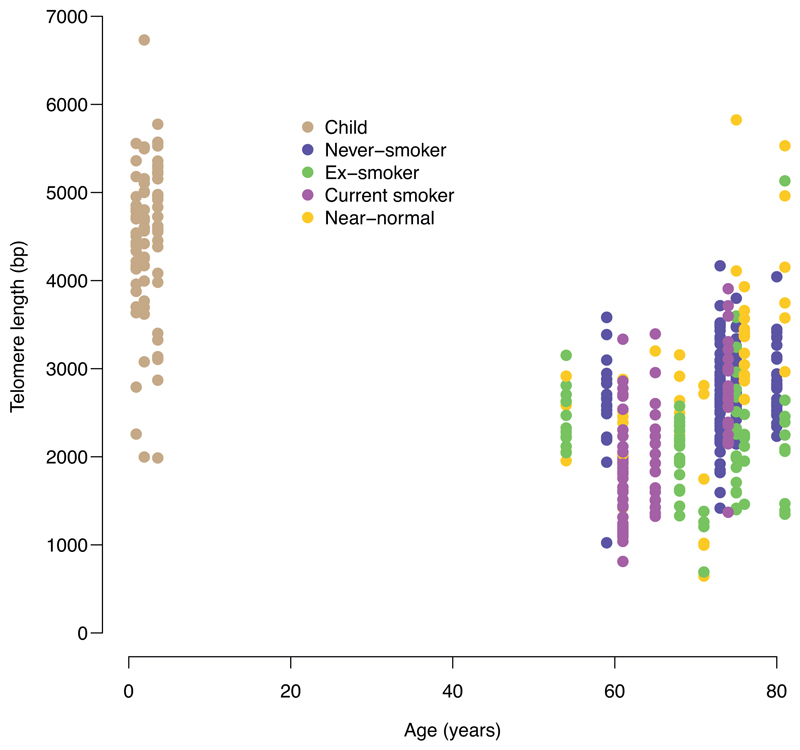
Extended Data Figure 10. Relationship of telomere lengths with age.
Scatter-plot of estimated telomere lengths (y axis) against age of subject (x axis). Individual points represent colonies (n = 398 colonies with <10% DNA deriving from the mouse feeder layer). Cells with near-normal mutation burden are identified in a gold colour.

