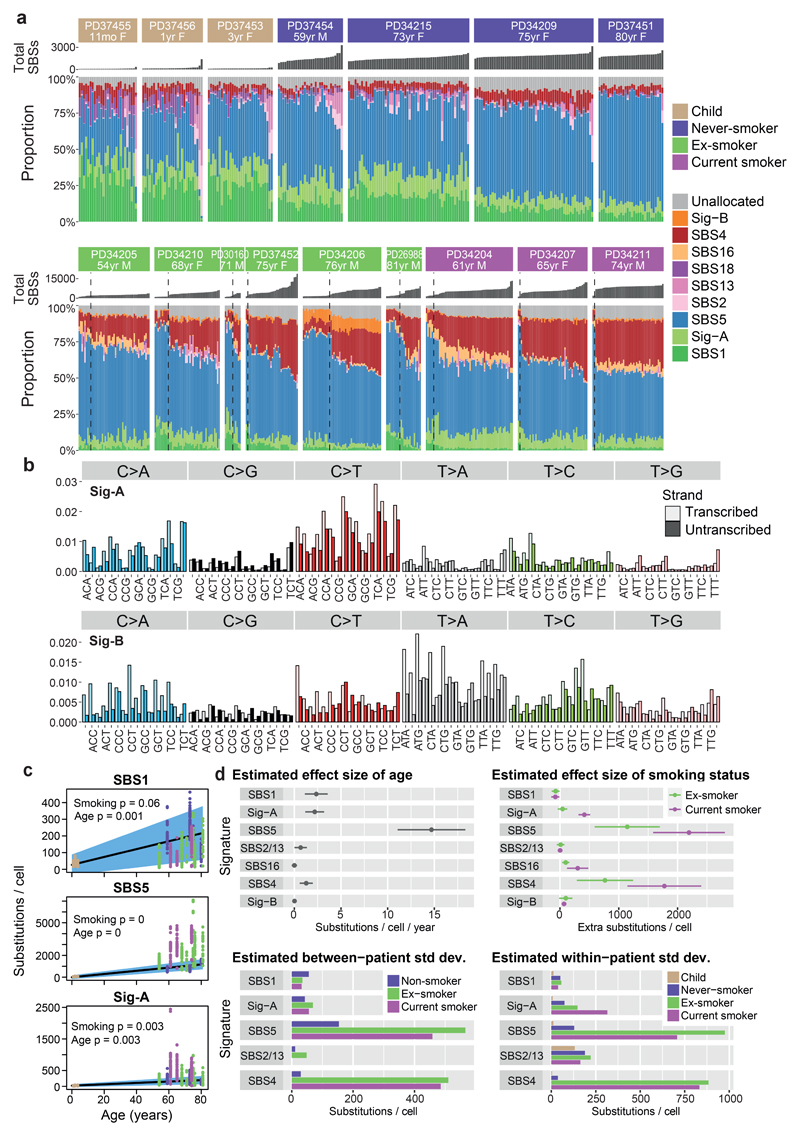
Figure 2. Mutation signatures in normal bronchial epithelium.
(A) Stacked bar-plot showing the proportional contribution of mutational signatures to single base substitutions across the n=632 colonies from normal bronchial cells, extracted using a hierarchical Dirichlet process. Within each patient, colonies are sorted from left to right by increasing mutation burden (bar chart in dark grey above coloured signature attribution stacks). Dashed black vertical lines in current and ex-smokers denote the cut-off between cells with near-normal and elevated mutation burden.
(B) Trinucleotide context spectrum on transcribed and untranscribed strands of two new single base substitution (SBS) signatures. The six substitution types are shown in the panel across the top. Within each panel, the trinucleotide context is shown as four sets of eight bars, grouped by whether an A, C, G or T respectively is 5’ to the mutated base, and within each group of eight by whether A, C, G or T is 3’ to the mutated base. Activity of the mutational signature on the untranscribed strand is shown in pale colour; on the transcribed strand in darker colour.
(C) Numbers of base substitutions attributed to the 3 endogenous signatures (y axis) across the cohort (n = 632 colonies) shown according to age of subject (x axis). Black line represents the fitted effect of age, estimated from linear mixed effects models after correction for smoking status and within-patient correlation structure. The blue shaded area represents the 95% confidence interval for the fitted line. The quoted p values for the fixed effects of age and smoking derive from the full linear mixed effects models.
(D) Estimated effect size of age, smoking status, between-patient and within-patient standard deviation of 7 signatures (points) with 95% confidence intervals (horizontal lines). Estimates are derived from linear mixed effects models (n = 632).

