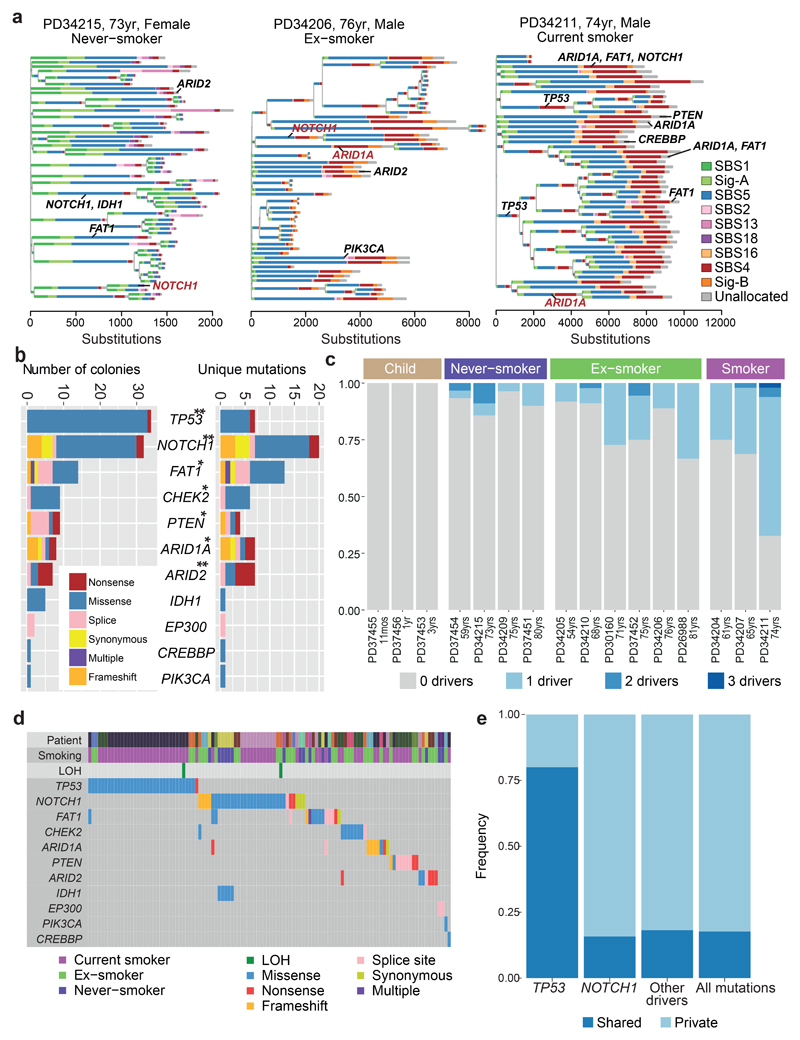
Figure 3. Driver mutations in normal bronchial epithelial cells.
(A) Phylogenetic trees showing clonal relationships among normal bronchial cells in 3 representative subjects. Branch lengths are proportional to the number of mutations (x axis) specific to that clone/subclone. Each branch is coloured by the proportion of mutations on that branch attributed to the various single base substitution signatures. Driver mutations identified in each branch (black: SBS, red: indel) are also shown.
(B) Total number of colonies with mutations (left panel) and number of unique mutations (right panel) in key cancer genes across the sample set (n = 632). ** represents genes significant (q<0.05 by dNdScv) when correction for multiple hypothesis testing is applied across all coding genes; * represents genes significant (q<0.05 by dSNdScv) when correction for multiple hypothesis testing is applied across known driver genes in lung cancers and normal squamous tissues (exact q values in Supplementary Table 4).
(C) Fraction of colonies with 0, 1, 2 or 3 driver mutations across the 16 subjects.
(D) Distribution of driver mutations across colonies in the cohort, coloured by type of mutation. Loss of heterozygosity (LOH) affecting driver mutations are also shown.
(D) The frequency of driver mutations shared by more than 1 colony in a patient (dark blue) versus found in a single colony (light blue) across different cancer genes.

