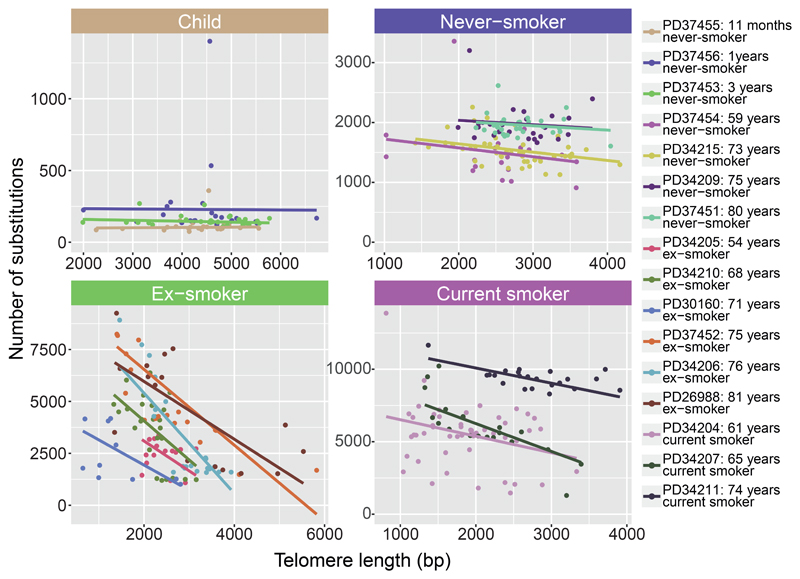
Figure 4. Relationship of telomere lengths with mutation burden.
Split by smoking status, panels show the relationship between telomere lengths (x axis) and mutation burden (y axis) for colonies with <10% contamination from the mouse feeder cells (n = 398 colonies). Individual cells are shown as points and fitted lines for each patient as coloured lines (slopes estimated using linear mixed effects models). The difference in slopes according to smoking status is highly significant (p=0.0009 for interaction term; LME models). One outlying cell in an ex-smoker with >10,000 mutations is excluded from the plot to improve visualisation.

