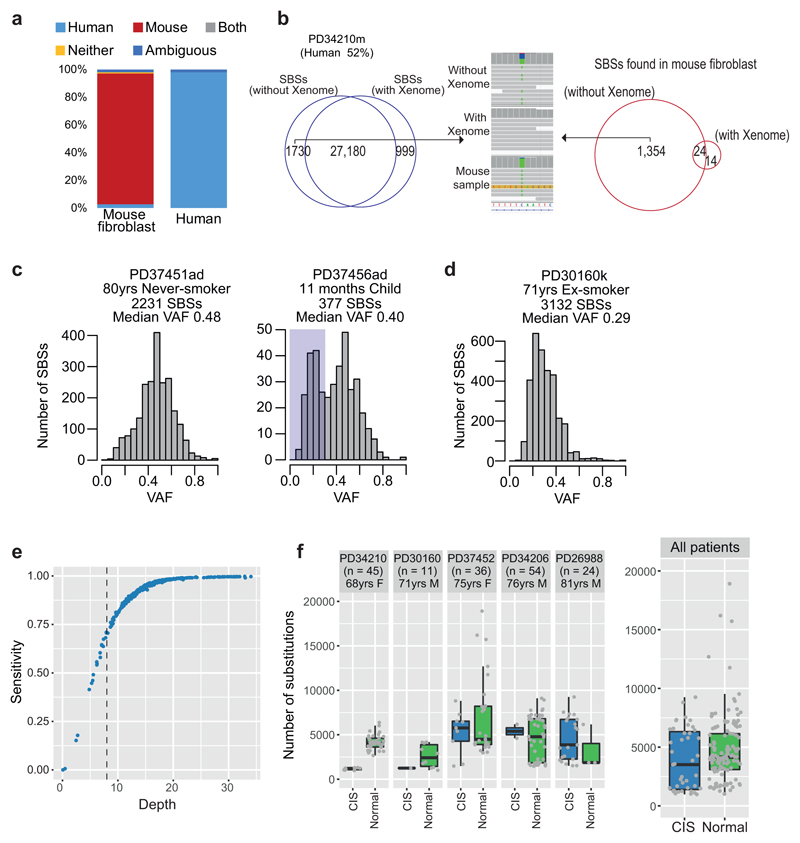
Extended Data Figure 2. Quality assurance of mutation calls.
(A) Stacked bar chart showing the proportion of reads attributed to the human genome, mouse genome, both, neither or with ambiguous mapping for the pure mouse fibroblast feeder line (left) or a pure human sample (right), assessed with the Xenome pipeline.
(B) Clean-up of mutation calls using the xenome pipeline for one of the samples more heavily contaminated by the mouse feeder layer. The Venn diagram on the left shows the overlap in mutation calls before and after removing non-human reads by xenome.
(C) Histograms of variant allele fraction (VAF) for two representative colonies in the sample set. The plot on the left shows a tight distribution around 50%, as expected for a colony derived from a single cell without contamination. The plot on the right shows a bimodal distribution with one peak at 50% (mutations present in the original basal cell) and a second peak at ~25%, likely representing mutations acquired in vitro during colony expansion. These second peaks at <50% are more evident in colonies from the children, due to the low number of mutations in the original basal cell.
(D) Histogram of variant allele fraction (VAF) for a colony seeded by more than one basal cell, leading to a peak <<50%.
(E) Estimated sensitivity of mutation calling according to sequencing depth. Heterozygous germline polymorphisms were identified in each subject – for each colony sequenced, we calculated the fraction of these polymorphisms recalled by our algorithms.
(F) Comparison of mutation burden in normal bronchial epithelial cells that neighbour a carcinoma in situ (CIS) versus distant from it in 5 patients. Box-and-whisker plots show distribution of mutation burden per colony within each subject, with the boxes indicating median and interquartile range, and the whiskers denoting the range. The overlaid points are the observed mutation burden of individual colonies.

