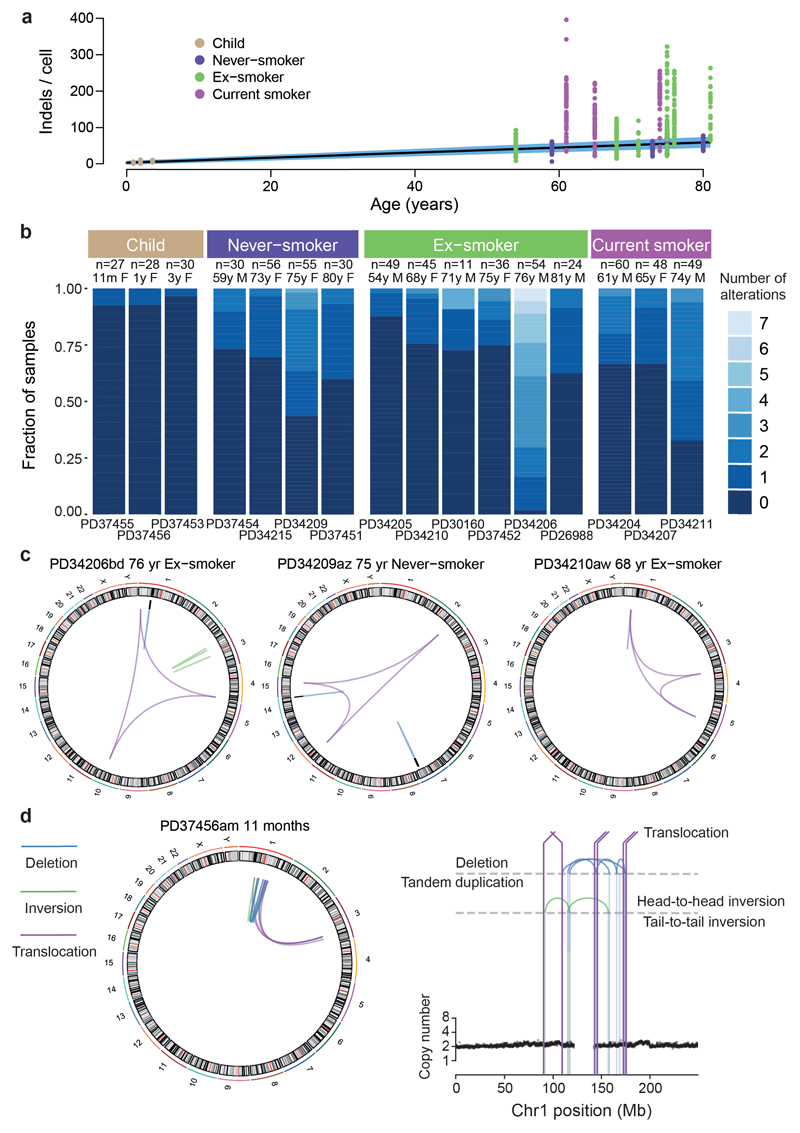
Extended Data Figure 4. Indels, copy number changes and structural variants in normal bronchial epithelial cells.
(A) Relationship of burden of indels per cell with age, with points representing individual colonies (n = 632), coloured by smoking status. The black line represents the fitted effect of age on indel burden, estimated from linear mixed effects models after correction for smoking status and within-patient correlation structure. The blue shaded area represents the 95% confidence interval for the fitted line.
(B) Stacked bar plot showing the distribution of colonies with 0-7 copy number changes and structural variants across the 16 subjects.
(C) Three examples of chromoplexy in normal bronchial cells. Structural variants are shown as coloured arcs joining two positions in the genome around the circumference. The chromoplexy instances all consist of 3 translocations, in purple.
(D) An example of chromothripsis in a cell from an 11-month old infant. The plot on the right shows copy number of genomic windows in the relevant region of chromosome 1 (black points), with the lines and arcs denoting positions of observed structural variants.

