
Figure 3. Cysteine Crosslinking between a Glutamate Residue in the Piezo1 Cap and Two Arginine Residues in the Blade Prevents Channel Opening.
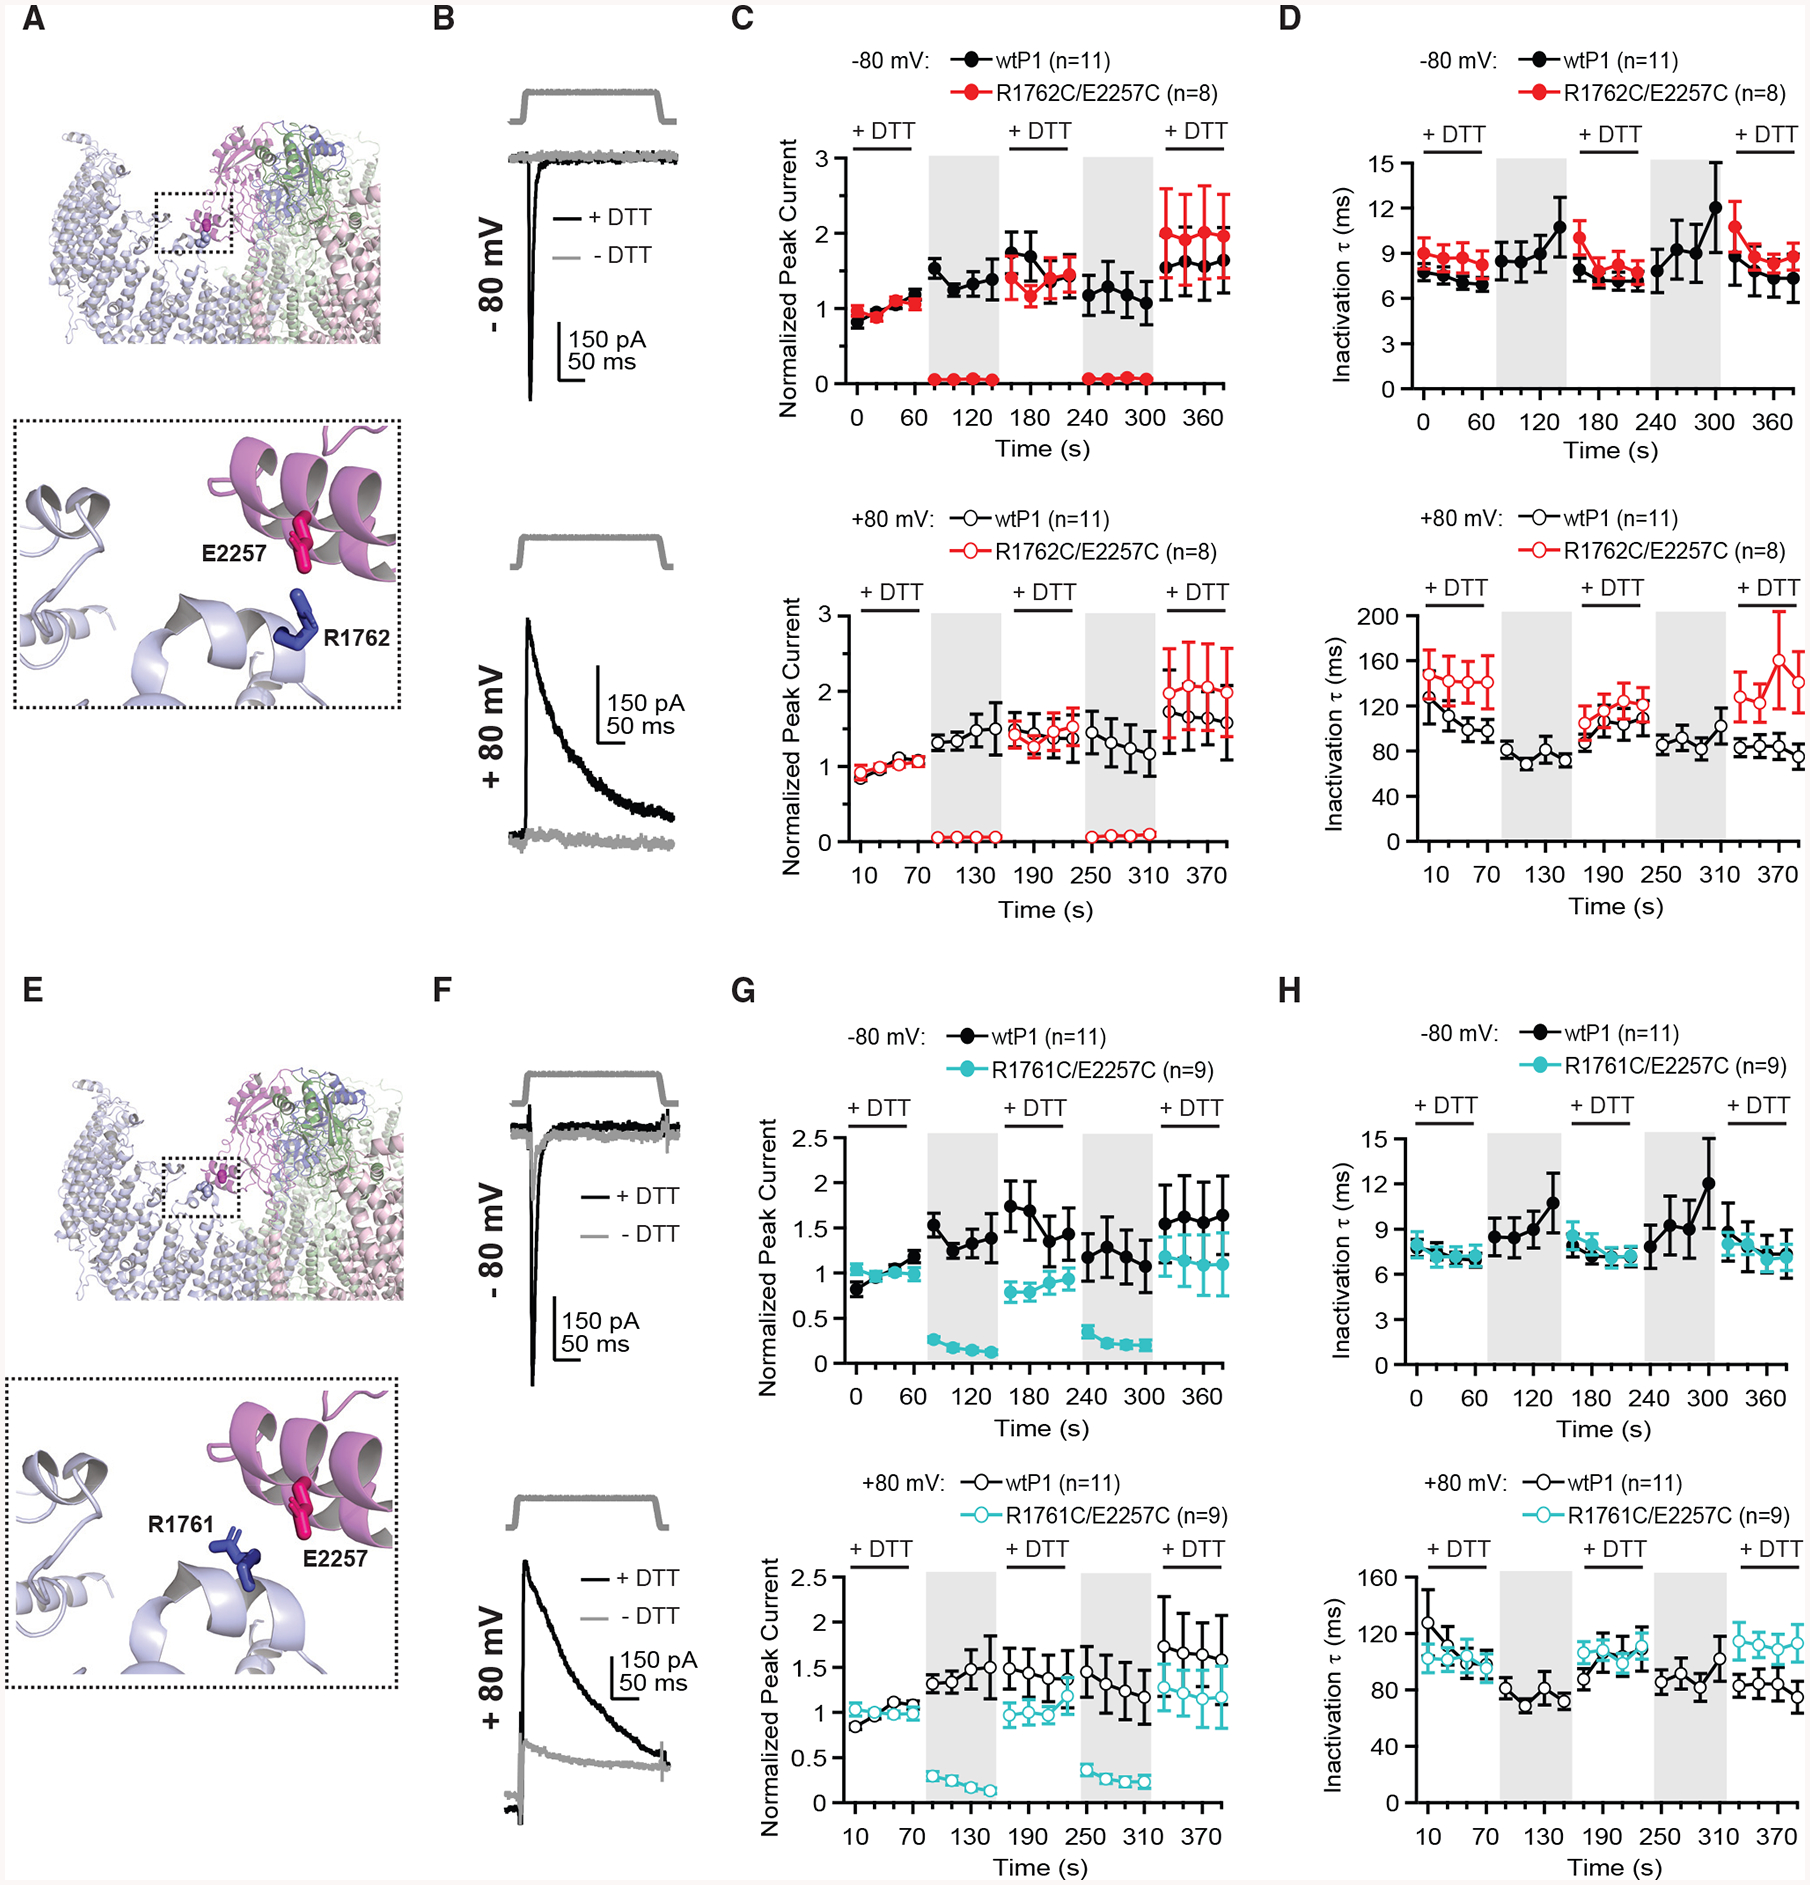
(A) Structural model of Piezo1 cap highlighting cysteine pair R1762C and E2257C. Colors indicate three subunits of Piezo1.
(B) Indentation stimulus protocol (3 μm) and representative currents from a cell transfected with R1762C/E2257C at −80 mV (top) and +80 mV (bottom) with (black) and without (gray) 10 mM DTT in the bath.
(C) Mean peak current from 8–11 individual cells, normalized to the average of the first four peak currents in DTT, for wtP1 and R1762C/E2257C, at −80 mV (top) and +80 mV (bottom).
(D) Mean inactivation time constant (τ) from 8–11 individual cells for wtP1 and R1762C/E2257C at −80 mV (top) and +80 mV (bottom).
(E) Structural model of Piezo1 cap highlighting cysteine pair R1761C and E2257C. Colors indicate three subunits of Piezo1.
(F) Indentation stimulus protocol (6 mm) and representative currents from a cell transfected with R1761C/E2257C at −80 mV (top) and +80 mV (bottom) with (black) and without (gray) 10 mM DTT in the bath.
(G) Mean peak current from 9–11 individual cells, normalized to the average of the first four peak currents in DTT, for wtP1 and R1761C/E2257C, at −80 mV (top) and +80 mV (bottom).
(H) Mean inactivation time constant (τ) from 9–11 individual cells for wtP1 and R1761C/E2257C at −80 mV (top) and +80 mV (bottom).
All data are mean ± SEM. See also Figures S2, S4, and S5.