Figure 2.
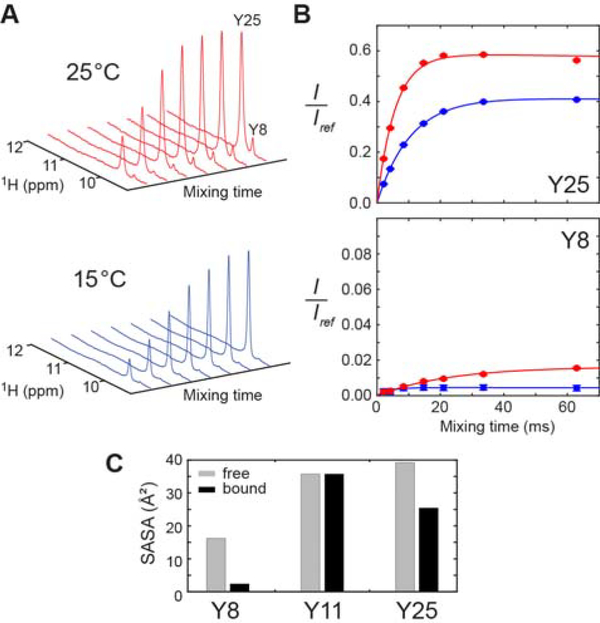
Hydrogen exchange of the interfacial Tyr OH groups of the Antp HD–DNA complex. (A) Series of 1D 1H spectra recorded in the 15N-filtered CLEANEX-PM experiment for the complex of 15N-lableled Antp HD and 15-bp DNA. (B) CLEANEX-PM data for determination of the hydrogen exchange rates kHX for Y8 and Y25 OH groups in the Antp HD–DNA complex at 25°C (red) and 15°C (blue). The ratio of the signal intensity observed in the CLEANEX-PM experiment to the signal intensity in the reference spectrum is plotted for each mixing time.35 The solid lines represent best-fit curves obtained through fitting as described by Hwang et al.38 The kHX rate for the Tyr25 OH group was 43 ± 3 s−1 at 15°C and 106 ± 4 s−1 at 25°C. The kHX rate for the Tyr8 OH group was determined to be 0.74 ± 0.04 s−1 at 25°C and 1.1 ± 0.6 s−1 at 15°C. (C) Solvent accessible surface areas of the Tyr Oη atoms in the crystal structure (PDB 9ANT).

