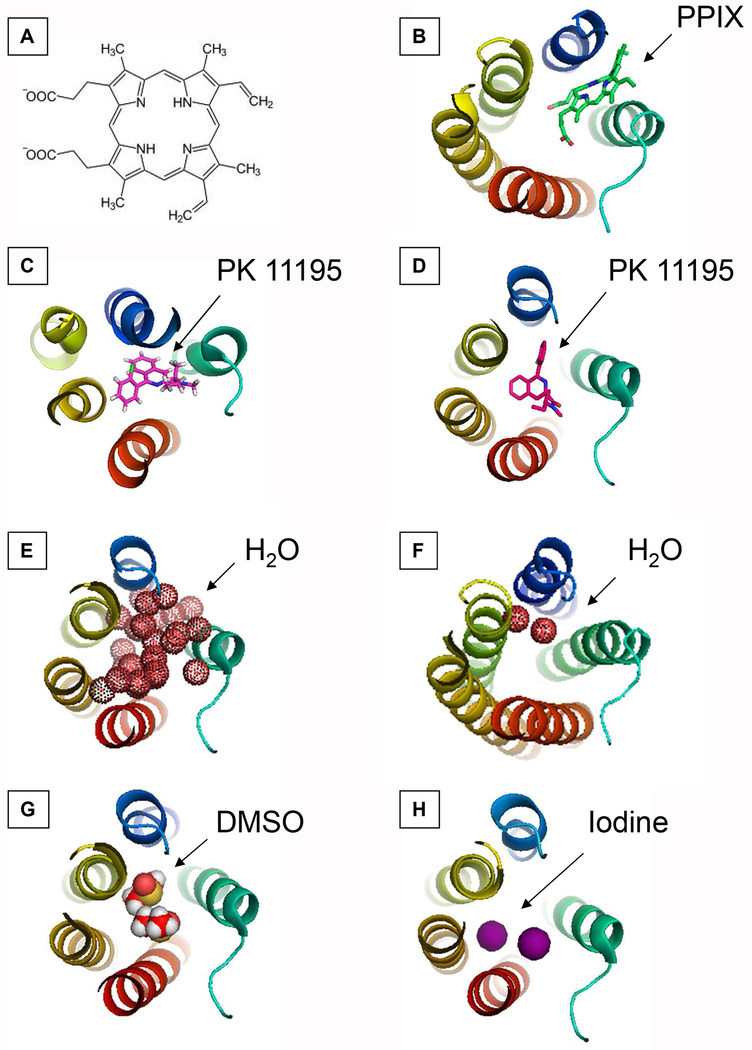
Figure 1. Overlap of molecules in the cavity of TSPO.
(A) Scheme of PPIX ligand structure.
(B) PPIX (carbons in green, oxygens in red) in RsTSPO (PDB entry 4UC1).
(C) PK 11195 (carbons in magenta, hydrogens in white, nitrogens in blue, chlorine in green) in BcTSPO (PDB entry 4RYI).
(D) PK 11195 (carbons in magenta, nitrogens in blue, chlorine in green) in mTSPO (PDB entry 2MGY).
(E) Water (doted red spheres) in BcTSPO (PDB entry 4RYQ). Dark red spheres correspond to water molecules in the selected slice whereas shadowed red spheres correspond to water molecules located underneath.
(F) Water (doted red spheres) in RsTSPO (PDB entry 4UC1).
(G) DMSO (carbons in red, hydrogens in white and sulfur in yellow) in BcTSPO (PDB entry 4RYO).
(H) Iodine (magenta spheres) in BcTSPO (PDB entry 4RYM)
In each case, the TSPO atomic structure is shown as rainbow cartoon colored as follows: TM1, blue; TM2, green; TM3, light green; TM4, yellow; TM5, red using PyMol (https://pymol.org/2/) [93].

