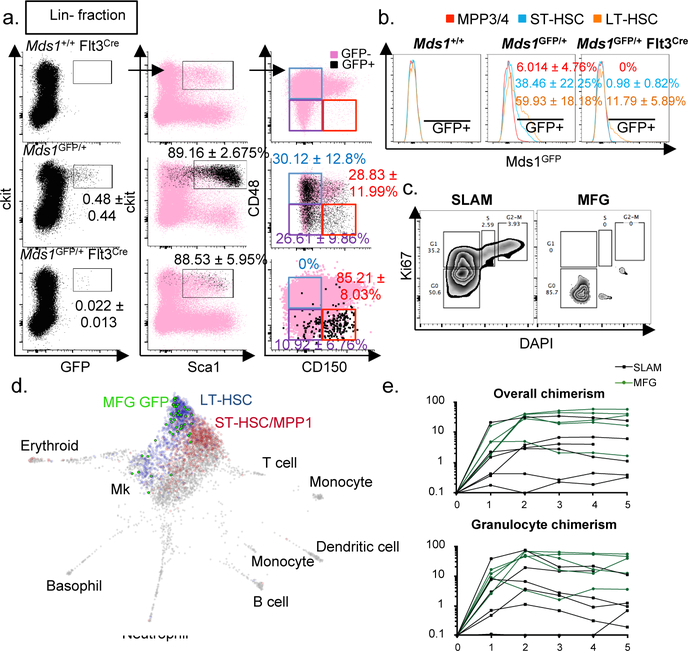
Figure 1. Generation and characterization of Mds1GFP/+ Flt3Cre (MFG) mice.
a, b, Flow cytometric analysis of Mds1GFP/+ only (N=10 mice) and Mds1GFP/+ Flt3-Cre (N=13 mice), mean ± SD. c, Cell cycle analysis of GFP+ cells from MFG mice vs. HSCs isolated based on SLAM immunophenotype. Representative analysis shown, depicting data from multiple mice (MFG=7 mice) or (SLAM=2 mice) which were pulled together to acquire the displayed data. d, SPRING plot layout of transcriptomes of 50 single MFG+ HSCs projected in published scRNA dataset of HSCs and MPPs (from Rodriguez-Fraticelli et al). Blue=LT-HSCs (789 cells), Red=ST-HCSs (742 cells), Grey=other cells, Bright Green=MGF HSCs (46 cells). e, Overall and granulocyte chimaerism post-transplantation in primary lethally-irradiated recipients transplanted with 25 MFG+ or SLAM cells from Mds1GFP/+ Flt3Cre mice. Each line represents an individual mouse. N=6 mice for SLAM group, N=5 mice for MFG sorted group. Only engrafted mice are represented.

