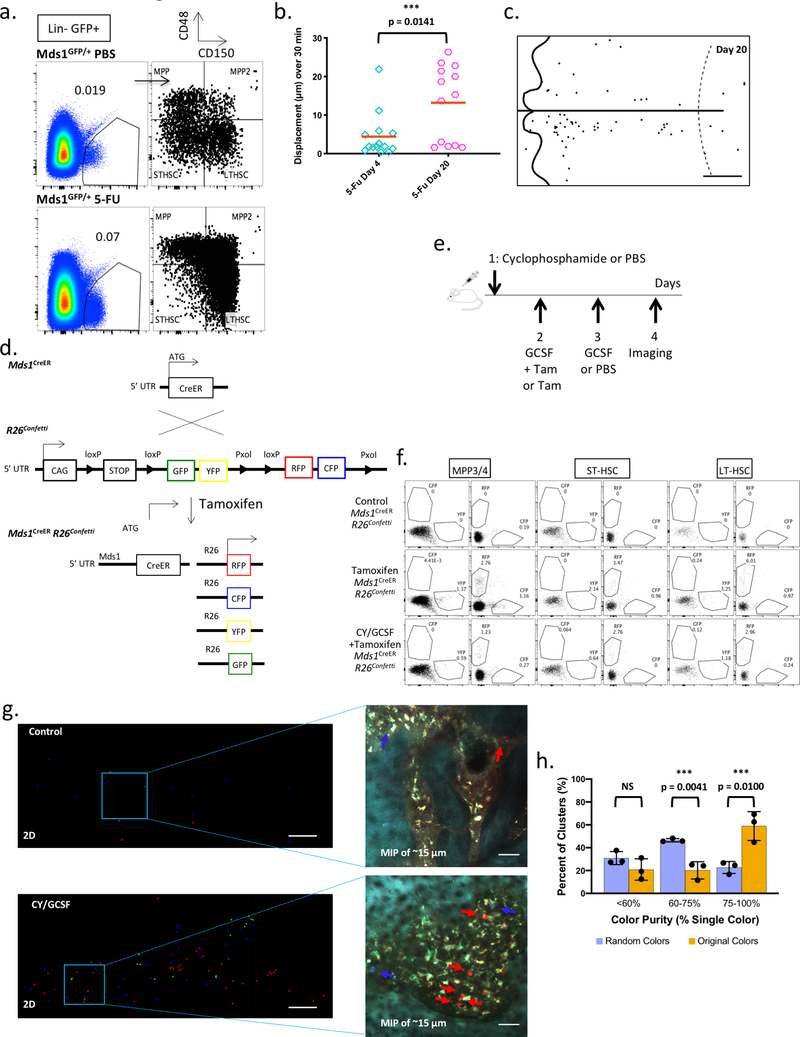
Extended Data Figure 8. Characterization of MFG HSCs upon activation.
a, Bone marrow analysis of HSPC (Mds1GFP/+) PBS control (N=1 mouse) and HSPC (Mds1GFP/+) 5-FU treated mice (N=2 mice, value represents mean), 17 days after treatment, demonstrates dramatic expansion of HSPCs even after recovery of blood (Extended data figure 1e). b, Graph showing in vivo motility measurements of MFG-HSCs at day 4 (n=14 cells) and day 20 (n=13 cells) after 5-FU treatment. Red bar represents mean. Compare to untreated Mds1GFP/+ Flt3Cre mice in Figure 3a and Extended data figure 7e. P value was calculated using a two-tailed Mann-Whitney test. c, Representative graphical map of the location of MFG-HSCs in the calvaria on day 20 after 5-FU treatment (N=2 mice). Scale bar ~500 μm. d, Generation of Mds1CreER/+ Rosa26Confetti/+ mice. e, Schematic illustration of Cyclophosphamide / GCSF treatment protocol for multi-colored Mds1CreER/+ Rosa26Confetti/+ labeling and activation. Low tamoxifen dosage (2 mg) was used to restrict recombination and expression of fluorescence in LT-HSCs that express higher Mds1 levels. f, Detailed flow cytometry analysis of MPP3/4, STHSC and LT-HSC differential color labeling upon treatment of Mds1CreER/+ Rosa26Confetti/+ mice shows enriched but not fully restricted labelling to LTHSCs. The experiment was performed one time. g, 2D graphical map of the 3D location of activated and labeled HSPCs in the fixed calvaria of control (left top, Tamoxifen only, N=2 mice) and induced (left bottom, Tamoxifen + Cy/GCSF, N=3 mice) mice along with maximum intensity projection (MIP) images (right top and bottom) of the Mds1 labeled cells (red, green, and blue). Scale bar for graphical map and MIP images ~200 μm and 50 μm, respectively. h, Graph showing the color purity of cell clusters (original colors) compared to randomized colors (10,000 cycles) in 3 independent experiments (N=3 mice). P values were calculated using two-tailed unpaired T tests. Bar graphs with error bars represent mean and SD, respectively.

