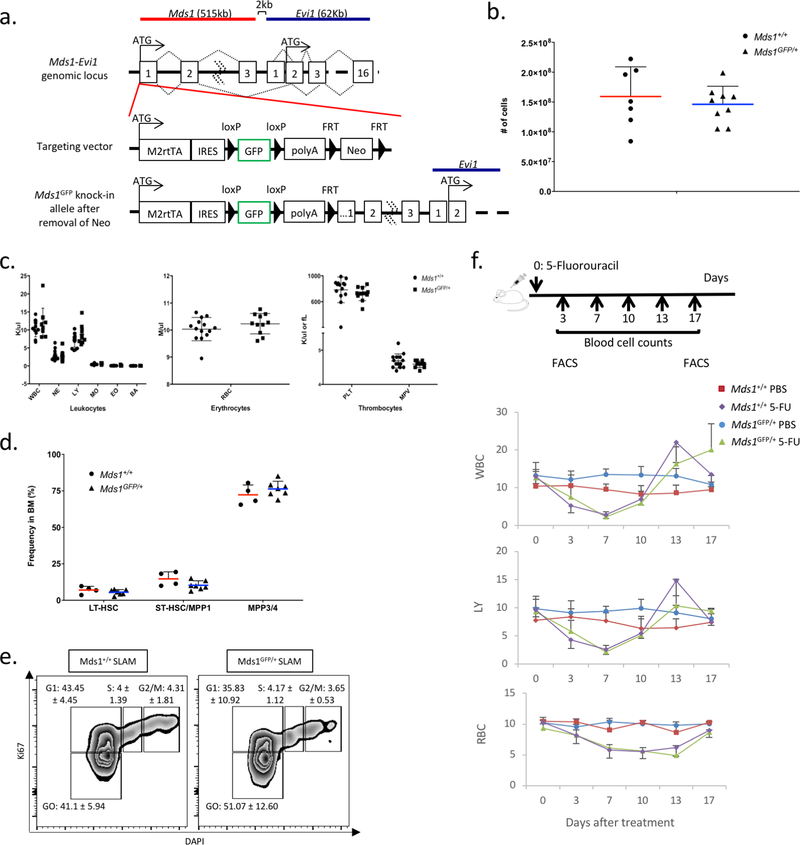
Extended Data Figure 1. Characterization of HSPC (Mds1GFP/+) mice demonstrates normal hematopoiesis, HSC frequency, cell cycle and stimuli recovery response.
a, Targeting strategy for the generation of Mds1GFP//+ mice. b, 8–12 week old Mds1GFP/+ mice (triangles, N=9 mice) displayed similar bone marrow cellularity as control mice (Mds1+/+) (circles, N=7 mice). Middle line represents mean. Error bars demonstrate SD. c, 8–12 week old Mds1GFP/+ mice (N=14 mice) displayed similar peripheral blood parameters as Mds1+/+ control mice (N=11 mice). Middle line demonstrates mean. Error bars demonstrate SD. d, 8–12 week old Mds1GFP/+ mice (triangles, N=7 mice) displayed similar CD150+CD48-LSK (LT-HSC), CD150-CD48-LSK (ST-HSC) and CD150-CD48+LSK (MPP) frequencies as control (circles, Mds1+/+) mice (N=4 mice). Middle line represents mean. Error bars demonstrate SD. e, Cell cycle analysis of SLAM cells from Mds1GFP/+ (N=3 mice) and wild type (Mds1+/+) mice (N=2 mice) in native conditions. Indicated value per gate represents mean ± standard deviation. f, Dynamics of white blood cells (WBC), lymphocytes (LY) and red blood cells (RBC) recovery upon 5-fluorouracil treatment in Mds1GFP/+ and control (Mds1+/+) mice. Middle value represents mean. Error bars represent standard deviation. N=4 mice.

