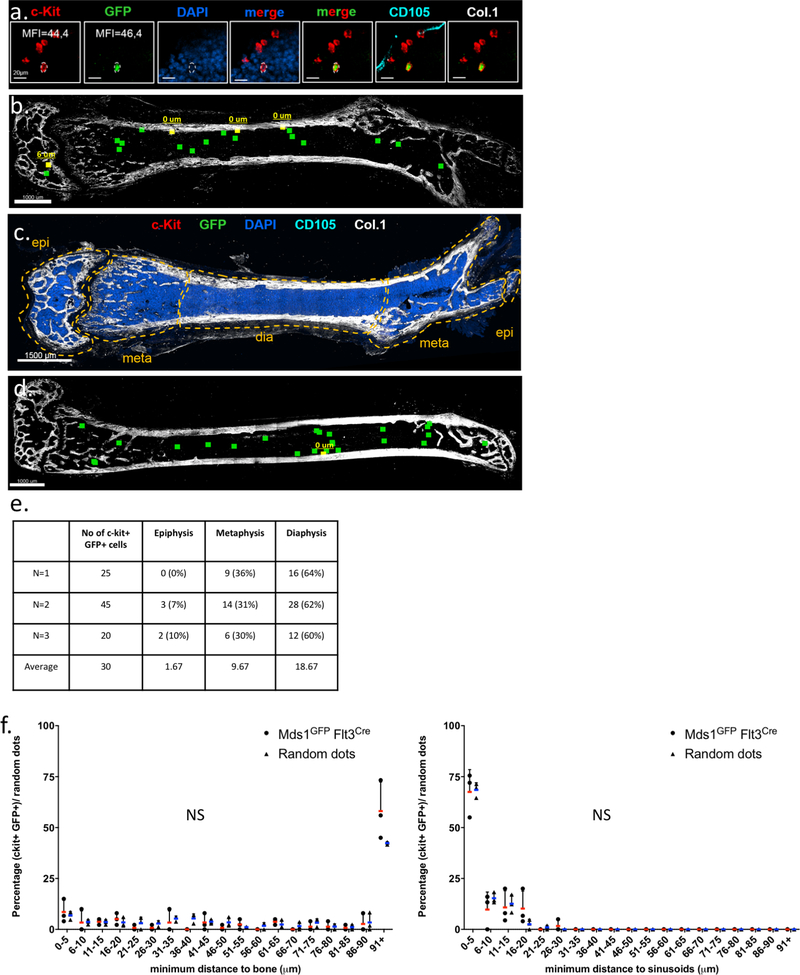
Extended Data Figure 5. Multicolor quantitative deep-tissue confocal imaging of complete femoral sections from MFG (Mds1GFP/+ Flt3Cre) mice.
a, Identification of cKit+ GFP+ MFG-HSCs using multicolor quantitative deep-tissue confocal imaging of full bone femoral sections. Pictures are 10 μm xy projections of one area of interest. (N=3 mice). The experiment was performed three times with similar data. b, Example of one full-bone femur section with color-coded visualization of HSCs based on their distance to bone. Yellow squares represent individual HSCs in proximity to cortical or trabecular bone, whereas green dots represent individual HSCs located more than 10 μm away. The picture represents data from an individual mouse. The experiment was performed three times with similar data (refer to panel d). c, Example of full-bone femoral section (only Col.1 and DAPI staining is shown). The experiment was performed three times with similar data. d, Color-coded visualization of HSCs based on their distance to bone. Yellow squares represent individual HSCs in proximity to cortical or trabecular bone, whereas green dots represent individual HSCs located more than 10 μm away. This picture represents an independent mouse from ext. fig 5b. The experiment was performed three times with similar data. e, Quantification of absolute number and anatomical location of c-Kit+ GFP+ MFG-HSCs per individual experiment. (N=3 mice) f, Spatial distribution of HSCs (circles) and random dots (triangles) relative to Col.1 marking bone surfaces and CD105+ vasculature (sinusoids) (N=3 mice). P values were calculated using two-tailed Kolmogorov–Smirnov (distance distributions, upper panel P=0.1516, lower panel P>0.9999) and one-tailed Mann-Whitney (first bin of histograms, upper panel, HSCs: 8.56±5.74, RDs: 6.88±1.94, P=0.50, lower panel, HSCs: 67.52±10.99, RDs: 68.53±3.51, P=0.35) tests. Data points with mean value represented by line (red for HSCs, blue for random dots) and error bars representing standard deviation are shown. N.S., not significant. Epi: epiphysis, meta: metaphysis, dia: diaphysis.

