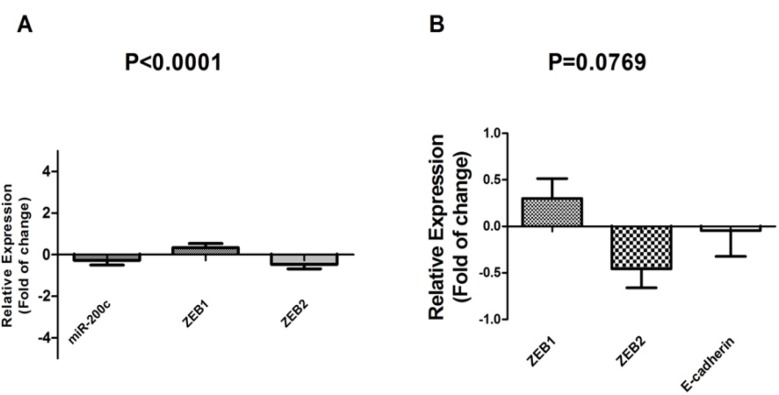
Figure 3.
A: Correlation of miR-200c and ZEB family expression level. Down_regulation of miR-200c expression leads to a decrease in ZEB1 expression level. B: Correlation of ZEB family and E-cadherin expression level (ANOVA). Up-regulation of ZEB1is associated with a significant down_regulation E-cadherin expression level (t-test) (p-value<0.05).

