
Fig. 10.
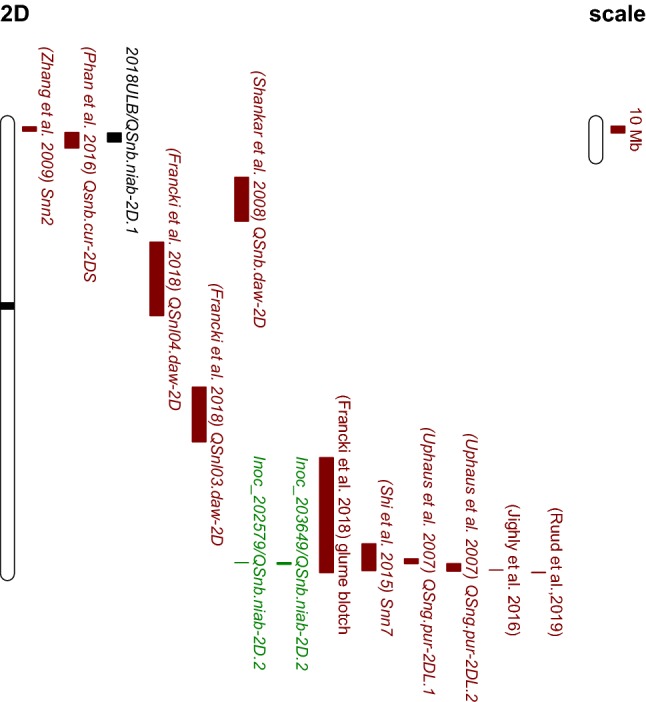
Physical map locations of QTL on chromosome 2D. QTL locations and interval sizes are indicated by bars on the right hand side of chromosome and are based on the data in Supplementary Table S4. QSnb.niab-2D.1 detected for leaf blotch 2018 in the UK and QSnb.niab-2D.2 detected by greenhouse inoculation in the ‘NIAB Elite MAGIC’ population. U UK, LB leaf blotch. QTL detected by this study: field leaf blotch QTL is indicated in black and seedling QTL in green. Published QTL are indicated in brown