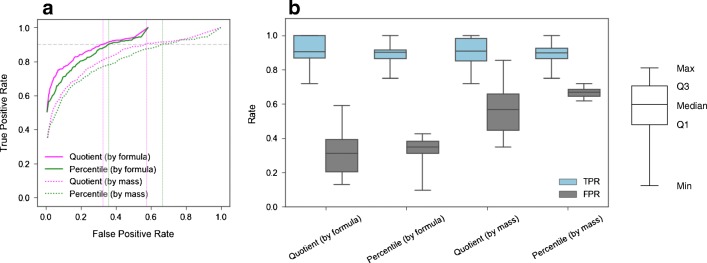
Fig. 4.
ROC curves (a) for ENTACT mixture data (all “pass” compounds from all ten mixtures) when using percentile and quotient cutoff values, and when filtering the CFM-ID database matches by mass or molecular formula. A global TPR of 0.90 (horizontal gray dashed line) results in percentile-based FPR values (green vertical dotted lines) of 0.67 (by mass) and 0.36 (by formula), and quotient-based FPR values (pink vertical dotted lines) of 0.57 (by mass) and 0.32 (by formula). Distributions (b) of true positive rates (TPRs) and false positive rates (FPRs) across individual ENTACT mixtures (n = 10) when selecting cutoff values based on a global TPR of 0.90 (from a)

