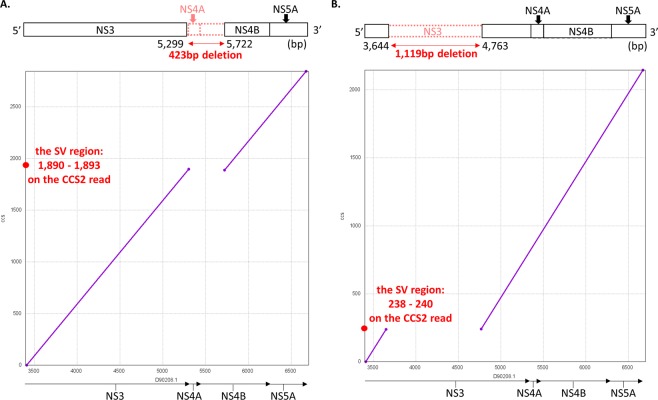
Figure 6.
The detection of the genome structure harbouring SVs between the NS3 and NS5A gene regions. The mapping software ngmlr version 0.2.6 aligned ≥5-pass CCS reads to the HCV genome, and the structural variation (SV)-calling software, Sniffles, detected ≥30-bp SVs. The figure demonstrates that two deletions exist at a relative abundance of ≥1% in the samples. In each panel, the upper schema shows the HCV genome with SV from the NS3 to the NS5A gene regions. The red symbols stand for the region that the SV in question occurred in. In particular, the inverted letters in the schema mean “inversion,” and the boxes with dash lines mean “deletion.” The genome positions described here are based on the HCV reference sequence (accession no. D90208.1). The lower image demonstrates the alignment of the representative reads supporting the SVs by the MUMmer program. The x-axis shows the position of the HCV reference genome. The Y-axis shows the position of the reads harbouring SVs. The purple solid line shows the alignment for an HCV reference genome without SVs. The blue solid line shows the inverted alignment for an HCV reference genome. The red point shows the SV region on the CCS2 read, which was used for SV validation. (A) In sample #12-SMV-post, a 423-bp deletion was detected. (B) In #12-SOF/LDV-pre, 1,119-bp deletion was clonally detected.

