Figure 3.
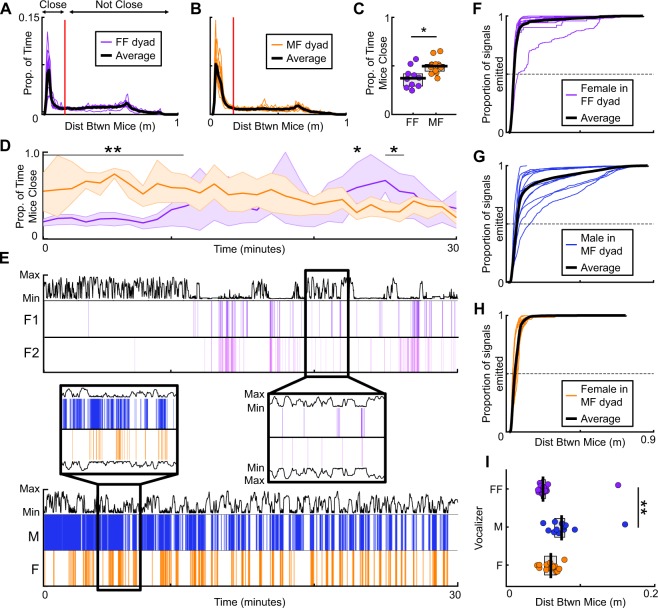
Female mice vocalize in close physical proximity to female conspecifics. Histogram shows the distances between mice during same-sex (A) and opposite-sex (B) social contexts. (C) Proportion of time that each pair of mice spent in close proximity (<20 cm; red line in A and B); dots represent pairs of mice; thick horizontal black line indicates group median; gray box shows IQR. (D) Proportion of each minute that pairs of mice spent in close proximity. Line = median; shaded region = IQR. Asterisks indicate significantly different proportions of time in close proximity during each one minute time interval. (E) Vocal emission over time during same-sex (purple; top) and opposite-sex (blue/orange; bottom) social contexts. Vocalizer identity labeled to the left (same-sex: F1 = Female 1; F2 = Female 2—arbitrarily numbered; Opposite-sex: M = Male; F = Female). Black trace shows distance between mice over time. Magnified insets (center) show vocal emission and the corresponding distance between mice. Distance traces above and below vocal emission are mirror images. (F–H) Cumulative density plots of the distance between mice during vocal emission. Dashed lines bisect each distribution at median distance between mice. (I) Median distance at which each mouse vocalized; thick vertical lines = median; gray boxes = IQR. **p < 0.01, *p < 0.05.

