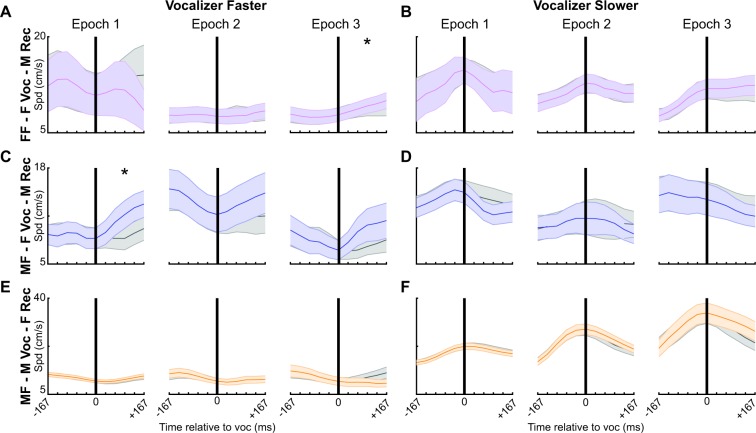
Figure 6.
Behavioral responses to vocal emission change over time. Speed of the receiving mouse (shown with colored lines; vocal trajectory) before and after temporally isolated vocal emissions (black vertical line; time = 0). Gray lines denote control speeds without vocal emission (non-vocal trajectory), with speeds prior to time 0 matched to a vocal trajectory. The shaded area indicates SEM. Recordings were segmented into three bins: the first (Epoch 1), second (Epoch 2), or final ten minutes (Epoch 3). Signals were separated based on the speed of the vocalizer at the time of vocal emission (vocalizer faster than receiver: A,C,E; vocalizer slower than receiver: B,D,F). Acceleration (change in speed) after time 0 was compared between the vocal and non-vocal trajectories. *p < 0.05. FF = same sex; MF = opposite sex; F Voc = female vocalizer; M Voc = male vocalizer.

