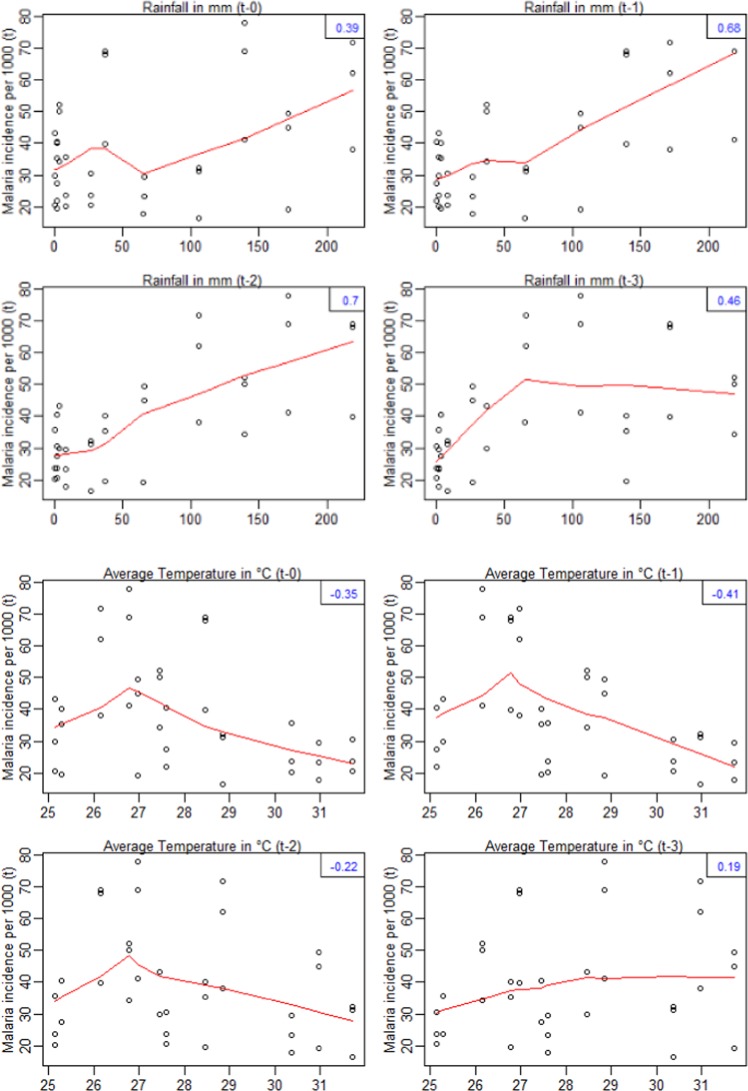
Figure 3.
Relationship (cross-correlation) between malaria in pregnancy incidence rate and meteorological variables. The red curves represent smooth relationships of incidence rate according to the meteorological variables and the lag-times. Numbers in blue (top right of each frame) represent the values of the correlation. The first four figures at the top represents the cross-correlation between monthly malaria incidence rate and monthly rainfalls. The last four figures represent the cross-correlation between monthly malaria incidence rate and monthly average temperature.

