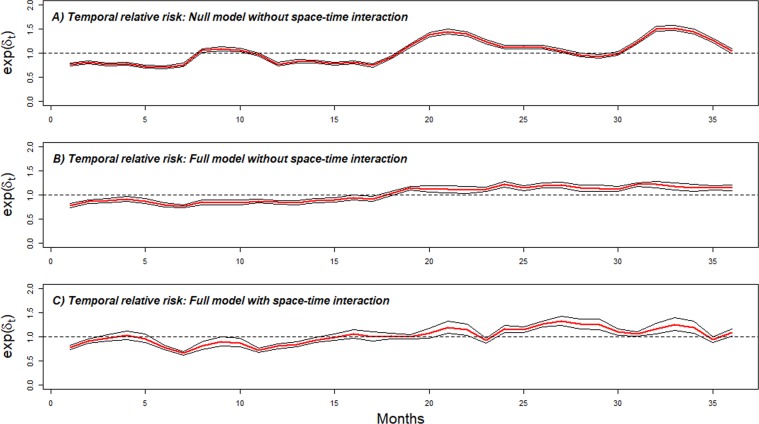
Figure 7.
Overall temporal trend (month specific risk) common to all communities exp(δt). Posterior median (red) and 95% credible interval (black). (A) Overall temporal trend from null model. (B) Overall temporal trend from full model without space-time. (C) Overall temporal trend adjusted for covariates effect with space-time. The dashed horizontal black line represents the monthly average of national temporal random effect (January 2015-December 2017).

