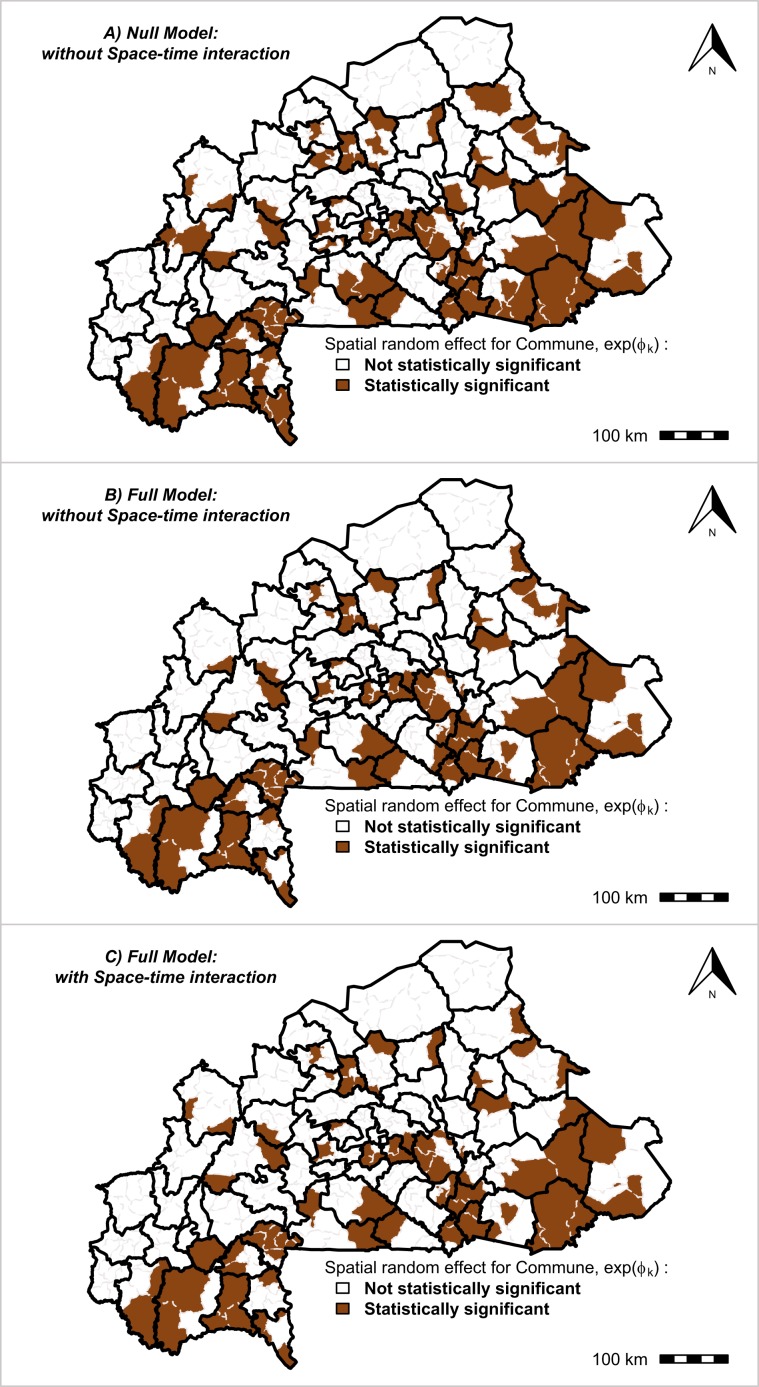
Figure 8.
Community specific relative risk of malaria in pregnancy. Overall spatial random effect common to all time periods in each community. Black bold lines correspond to the limits of the health-districts (70 health-districts) and gray lines in each health-district correspond to the limits of communities (351 communities) Source: The shapefile was obtained from the “Base Nationale de Découpage du territoire” of Burkina Faso (BNDT, 2006). The malaria in pregnancy data were obtained from the National Malaria Control Program of Burkina Faso, downloaded from the District Health Information System 2. Maps created by Toussaint Rouamba et al., 2019.

