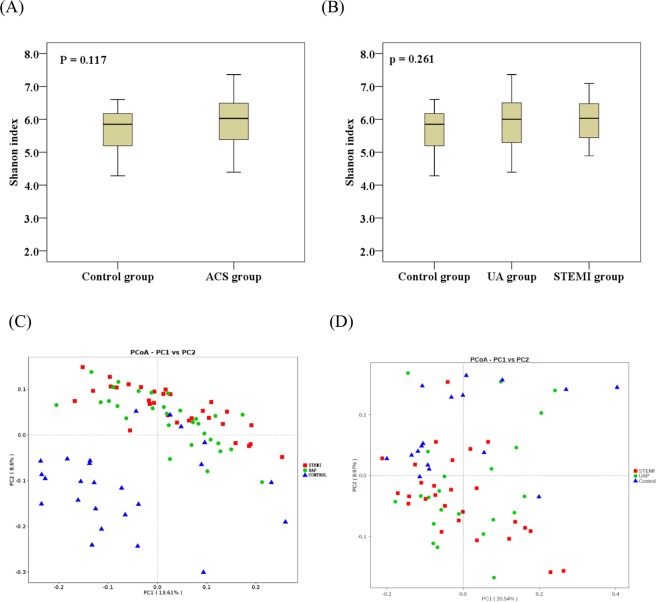
Figure 1.
Gut microbial composition in stool of human adults with or without ACS. The microbial abundance and α-diversity (Shannon index) based on the profile of family and genera between (A) control and ACS groups and (B) control, UAP, and STEMI groups. Principle Coordinate Analysis (PCoA) (weighted UniFrac distance) showed that ACS and control groups were distinguished by total (C) or top 40 (D) abundant stool microbial taxa (P < 0.05), yet overlapping clustering was observed between UAP and STEMI groups.

