
Figure 3.
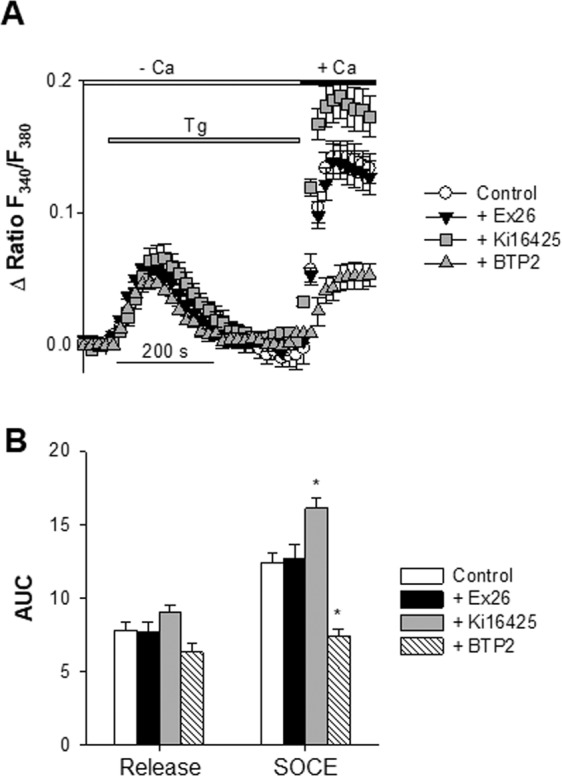
Effects of Ex26, Ki16425, and BTP2 on the thapsigargin-evoked Ca2+ release and SOCE. SOCE responses were analysed with Fura-2. Cells were kept in a nominally Ca2+-free medium. ER Ca2+ stores were depleted with thapsigargin (Tg, 200 nM) before re-introducing external Ca2+. The resulting increase in intracellular Ca2+ is due to Ca2+ entering via the plasma membrane. Panel A shows somatic Ca2+ responses (expressed as Δ ratio F340/F380) as a function of time, and generated by the sequential addition of Tg (200 nM, horizontal gray bar) followed by the readmission of 2 mM external Ca2+ (horizontal black bar). Four conditions are shown: without antagonists of LPA and S1P receptors (Control, open circles, n = 7), with 1 µM Ex26 (gray triangles, n = 5), with 10 µM Ki16425 (filled squares, n = 5), and with 1 µM BTP2 (symbols, n = 5). When tested, Ex26 (or Ki16425) and BTP2 were added 4–7 and 11–12 min, respectively, before time 0 and were also present during the recordings. One time point out of 3 is shown. Panel B shows the thapsigargin-evoked Ca2+ release and SOCE measured as area under the curve (AUC). Mean ± SEM.