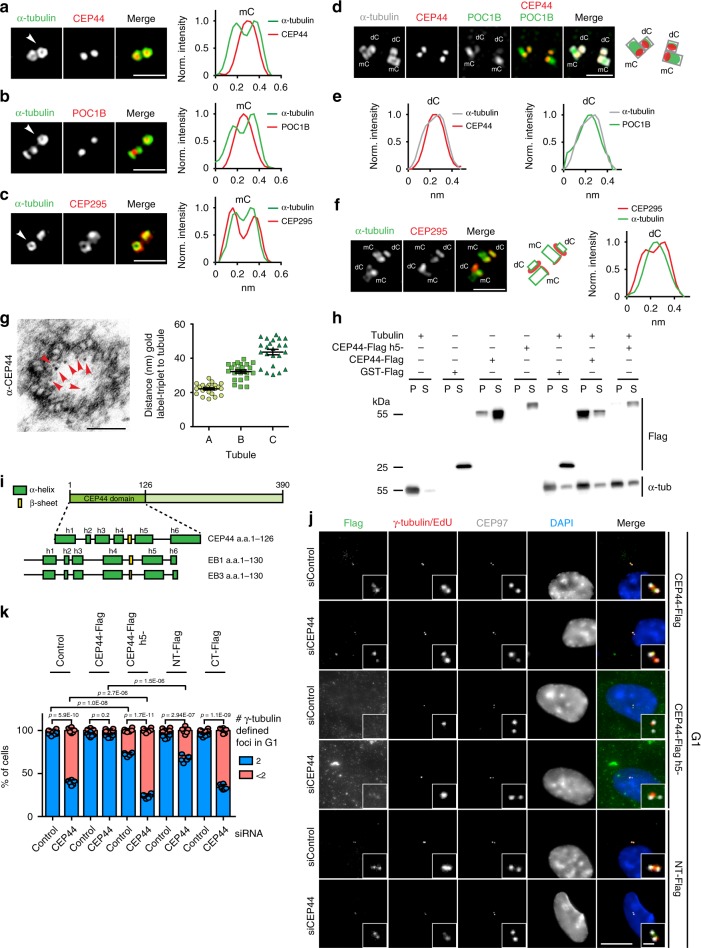
Fig. 4. CEP44 localises to the centriole lumen via its MT-binding affinity.
a–c 2D-SIM images of G1 centrioles (α-tubulin) and corresponding normalised intensity profiles of centrosomes positioned perpendicularly to the imaging plane (white arrows). a CEP44 localised in the centriole lumen as POC1B (b). c CEP295 decorates the outer centriolar wall. d 2D-SIM of centrosomes with duplicated centriole pairs co-stained with α-tubulin, CEP44 and POC1B. e Intensity profiles of dC cross-section. CEP44 (left) and POC1B (right) reside in the dC lumen. f (left) 2D-SIM of centrosomes with duplicated centriole pairs co-stained with α-tubulin and CEP295. f (right) Intensity profiles of dC cross-section. g CEP44 immuno-gold labelling in purified centrosomes (left). Red arrows indicate 10 nm gold particles. g (right) Distance of the gold particles from A-, B- and C-tubule of the same triplet respectively 21.9 ± 3.1 nm, 32.0 ± 4.7 nm, 43.1 ± 7.5 nm (all cases, n = 23 particles, data present mean ± s.d.). h Binding assay of recombinant CEP44-Flag and h5- mutant purified from E.coli to MTs. GST-Flag was used as control. Proteins were incubated with soluble polymerised tubulin. MTs with bound proteins were sedimented by centrifugation. The supernatant (S) and pellet (P) were analysed by IB for α-tubulin and Flag. Supplementary Fig. 8f shows Coomassie blue stain gel of purified proteins. i Schematic representation of CEP44 domain organisation. (Bottom) Comparison of CEP44 domain predicted secondary structure organisation with the MT-binding domain of EB1 and EB3 proteins. j The h5- and the NT-fragment could not rescue the CCC defect vs. CEP44-Flag. Constructs were mildly expressed by the addition of 2 ng/ml doxycycline. k Quantification of j and Supplementary Fig. 9c. While the CT-Flag was unable to rescue the loss of PCM (63.9 ± 3.2% of cells with <2 γ-tubulin foci) and the NT only partially (32.6 ± 3.8%), the h5- mutant generated a CCC defect even in the siControl (27.6 ± 2.3%) and a stronger CCC phenotype in the siCEP44 (76.1 ± 2.6%). Data presented as mean ± s.d., all statistics derived from two-tail unpaired t-test analysis of n = 6 biologically independent experiments. (a, b, c, d, f, scale bars: 1 μm; g, scale bar: 100 nm; j, scale bar 10 μm, magnification scale bar: 1 μm). (a–c, e–g, k) Source data are provided as a Source Data file.

