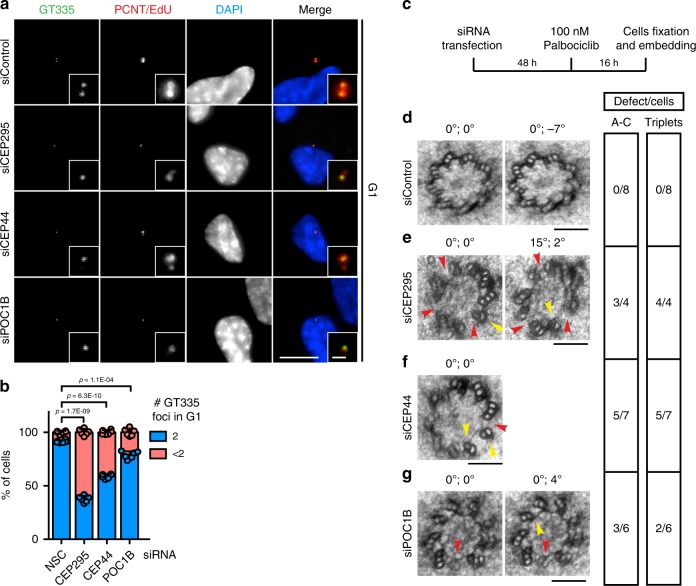
Fig. 6. Conversion molecules provide structural integrity of centrioles.
a IF samples of cells treated with siControl, siCEP295, siCEP44 or siPOC1B. Depletions of siCEP295, siCEP44 or siPOC1B generated G1 cells (Cenp-F in Supplementary Fig. 11b) with <2 centriole glutamylation foci (GT335 signals) different from siControl. b Quantifications of a. 62.4 ± 3.0% of G1 siCEP295 cells showed <2 GT335 foci; 41.2 ± 2.2% in siCEP44 cells; 21.3 ± 3.5% in siPOC1B cells. Data are presented as mean ± s.d., statistics were derived from two-tail unpaired t-test analysis of n = 6 biologically independent experiments and source data are provided as a Source Data file. c Scheme of the experimental procedure of the EM analysis of dCs. d–g EM images of turned and tilted sections of proximal region of daughter centrosomes in G1. The two values on the top of the image give the sample turning and tilting degrees, respectively. Red arrowheads indicate open structural defects (A-C linker absent), while yellow ones highlight defects of triplets. The side table (right) shows quantification of the number of cells showing these defects. While in d G1 siControl cells there was no structural defect, in e siCEP295, f siCEP44 and g siPOC1B G1 cells dCs showed defects in the triplets and A-C linker formation. (a scale bar: 10 μm, magnification scale bar: 1 μm; d–g, scale bars: 100 nm).

