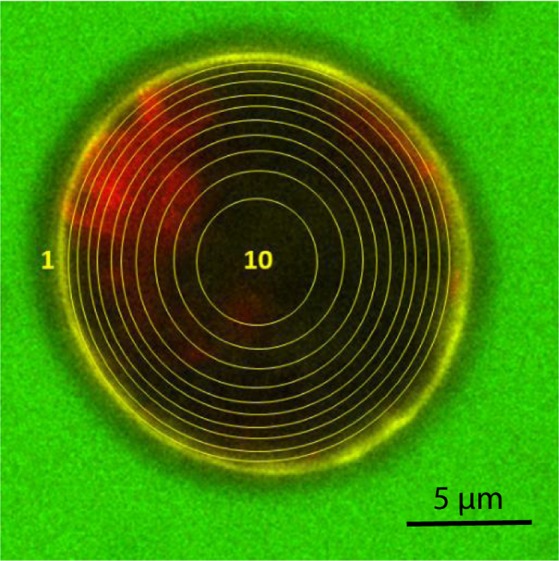
Figure 2.

CLSM image of C. reinhardtii after a PEF treatment (5.5 kV/cm, 5 µs, 10 pulses). The cell is electroporated in a medium containing 3 kDa Dextran-FITC. It is segmented into nine concentric rings: from ring n°1, that excludes the cell wall, to ring n°9) and one inner circle (n°10), all equal in terms of area. Scale bar: 5 µm. The chlorophyll is detected in red, the cell wall is stained in yellow by ConA and dextran is detected in green (the green fluorescence inside the cell isn’t easily visible but can be further analysed as shown in the section Methods)34.
