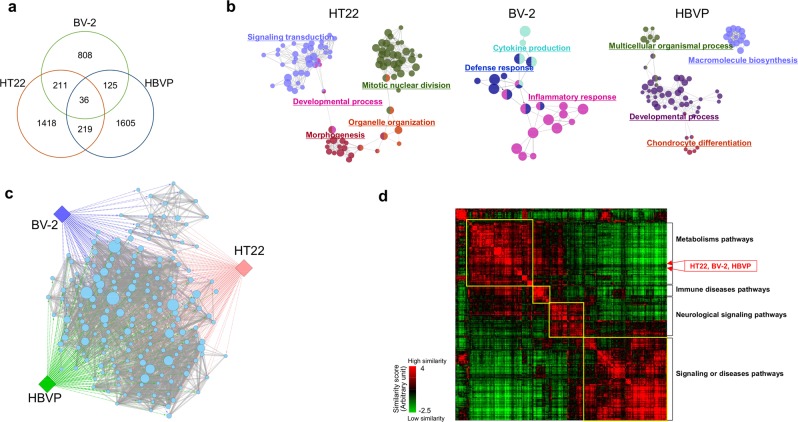
Figure 2.
Functional characteristics of genes from stimulated neurovascular cells. HT22 hippocampal cells, BV-2 microglia, and HBVP pericytes were exposed to H2O2, LPS, and TGF-β1, respectively. Total RNA extracts from cultivated cells and mouse hippocampi were analyzed by RNA-seq technology. Gene expression levels were compared with those of control cells to obtain expression ratios. Genes showing expression ratios above 2 or below 0.5 in each experimental condition were identified as DEGs. (a) The distribution of DEGs among neurovascular cell types is shown as a Venn diagram. (b) The functional characterization of DEGs from each stimulated neurovascular cells (HT22, BV-2, and HBVP) was assessed using ClueGO. The GO terms enriched in each stimulated neurovascular cell type were clustered (FDR < 0.01) and represented with the same color. Representative GO terms for each cluster are shown. The size of each node indicates the enrichment significance of the GO term. (c) GO terms associated with DEGs from each stimulated neurovascular cell type were identified with DAVID and redundancies removed using ReviGO. The resultant GO terms were connected with each other based on common genes (p < 0.001) using the Enrichment Map. The diamond and circle represent neurovascular cell type and GO terms, respectively. Circle node size and edge thickness represent the number of genes included in a GO term and shared by two GO terms, respectively. A detailed image with GO terms is shown in Supplementary Fig. S5. (d) DEGs from neurovascular cells were mapped into a PPI network. Based on the shortest path length of the DEGs to each gene set of 281 pathways, the position of neurovascular cell types were determined, indicated with red arrows. Representative biological functions of each cluster of pathways are shown in the right side of the image.

