Figure 4.
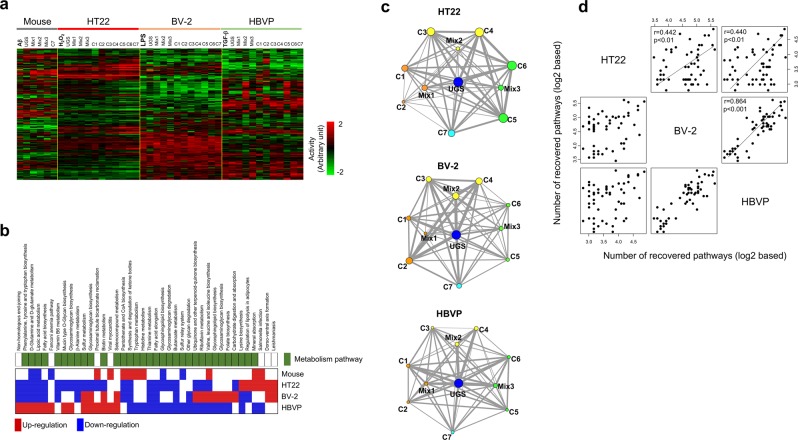
Therapeutic similarities between neurovascular cell types based on pathway activity. (a) Pathway activities from stimulated neurovascular cells were calculated by linearly combining expression levels of the genes included in each pathway. These values of pathways activities were then hierarchically clustered. Only pathways showing significant variations (FDR < 0.01) over all neurovascular cell types were included. The rows and columns represent individual samples pathways, respectively. The red and green colors reflect the high and low levels of pathway activity, respectively, as indicated by the scale bar in arbitrary units. (b) Distribution of pathways significantly involved (FDR < 0.001) among at least 2 types of stimulated neurovascular cells were examined. The position of metabolism-related pathways is indicated in green. Up- and downregulated pathways are colored in red and blue, respectively. (c) As in the case of gene expression, by measuring the therapeutic profile between each pair of herbal components in terms of commonly recovered pathways, therapeutic networks were constructed. Differentially regulated pathways were selected as those pathways with FDR ≤ 0.01 in stimulated neurovascular cells. Among these differentially regulated pathways, a 50% reduction in activity induced by herbal components was considered as recovery of the pathway activity. Based on the recovery pattern of pathway activity, we measured the number of pathways recovered in common between two herbal components. After extending this measurement to all combinations of herbal components, we constructed the therapeutic network in terms of commonly recovered pathways. Node size and edge thickness represent the number of recovered pathways by each herbal component and the number of commonly recovered pathways between two herbal components, respectively. (d) The structure of the therapeutic network obtained from each neurovascular cell type was then compared with those from other cell types to obtain the correlation patterns between neurovascular cell types.

