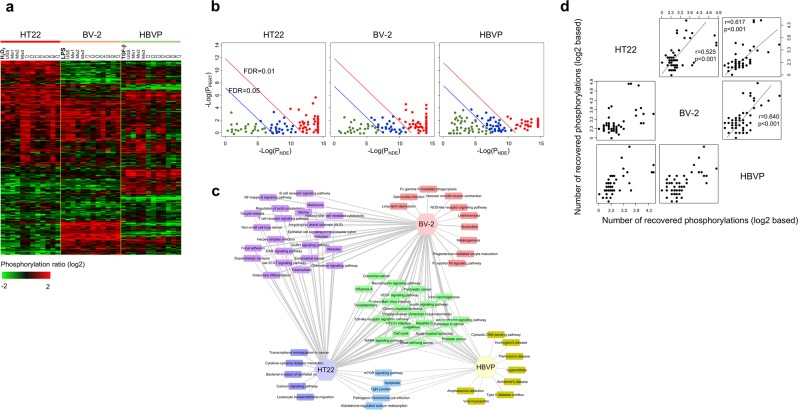
Figure 5.
Regulation of phosphorylations by UGS and its components. (a) The phosphorylation status of signaling proteins was measured using antibody array technology from stimulated neurovascular cells. Protein phosphorylation levels were compared with those of control samples to obtain phosphorylation ratios. A phosphorylation profile was obtained by hierarchically clustering approximately 310 proteins showing significant variation (standard deviation > 1.0) over all neurovascular cell types. The red and green colors reflect high and low protein phosphorylation, respectively, as indicated by the scale bar. A detailed image is shown in Supplementary Fig. S9. (b) Enriched signaling pathways from protein phosphorylation in stimulated neurovascular cells were analyzed with the Signaling Pathway Impact Analysis (SPIA) program. The horizontal axis represents pathway overrepresentation (PNDE), while the vertical axis indicates pathway perturbation (PPERT). The red and blue circles on the right of the red oblique lines represent significant pathways after FDR correction (0.01 and 0.05, respectively) of the global p-values (PG), representing the pathway ranks calculated from the combination of both PNDE and PPERT. The list of phospho-based pathways is shown in Supplementary Table S2. (c) The distribution of significant pathways (FDR < 0.01) from SPIA was displayed in connection with neurovascular cell types. A detailed image is shown in Supplementary Fig. S10. (d) From the phosphorylation profile, differentially phosphorylated proteins were defined as proteins showing a change of phosphorylation status above 2 or below 0.5 compared with control samples in each stimulated neurovascular cell type. Then, the effects of each herbal component were measured by observing recovery of phosphorylation. Recovered proteins were defined as those whose phosphorylation was restored to normal levels (phosphorylation ratio between 0.5 and 2). Based on the recovery pattern of phosphorylation, we measured the number of proteins recovered in common between two herbal components. After extending this measurement to all combinations of herbal components, we constructed the therapeutic network in terms of commonly recovered phosphoproteins. Then, the correlation between neurovascular cell types was assessed in terms of the similarity of patterns of phosphorylation recovery by herbal components.

