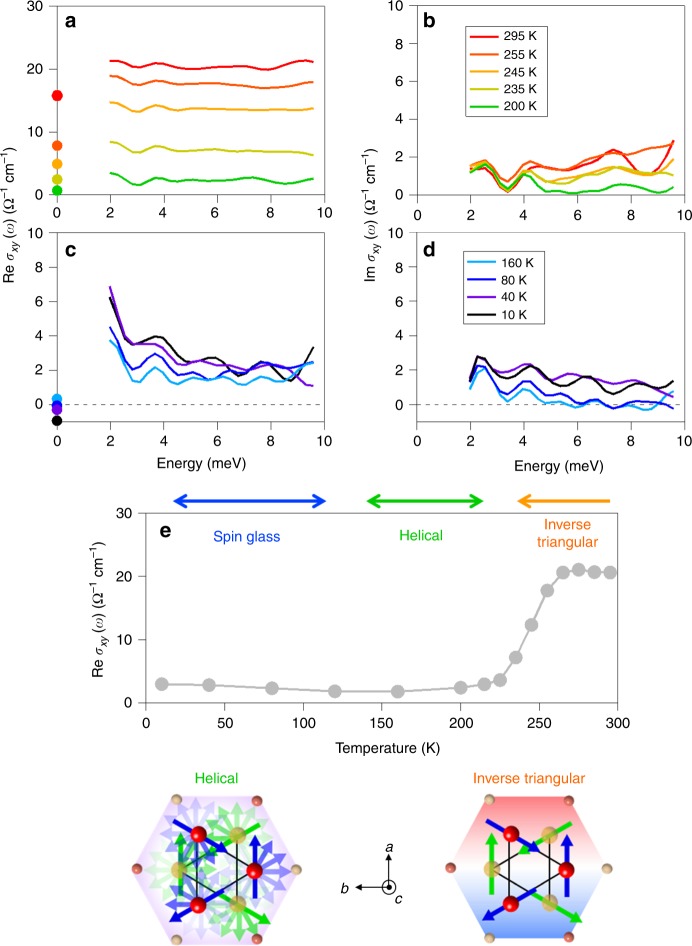
Fig. 3. Temperature dependence of THz anomalous Hall conductivity spectra.
a–d The real and imaginary parts of the Hall conductivity for a sample (x = 0.02) from 300 to 200 K (a, b) and from 160 to 10 K (c, d). The filled circles are the DC Hall conductivities at each temperature. e Temperature dependence of the real-part THz Hall conductivity. The lower panel shows the top views along c-axis of the magnetic structure at each phase.

