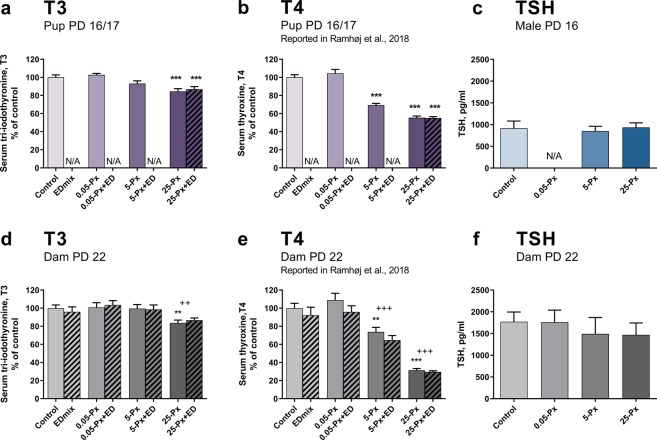
Figure 2.
T3, T4 and TSH after developmental exposure to PFHxS. (a) PFHxS decreased pup T3 levels at 25 mg/kg on PD 16/17, mean of the controls was 1.48 nM. Data shown as mean + SEM. n = 14–16 (except control with n = 18) litters represented by either a male or a female pup. (b) Pup T4 was reduced from 5 mg/kg PFHxS (absolute values previously reported36. n = 14–16 (except control with n = 18) litters represented by either a male or a female pup. (c) TSH in male pups PD 16. n = 11–13. (d) T3 levels in dams on PD 22, mean of the controls was 1.45 nM. n = 13–15. (e) Dam serum T4 at PD 22 was reduced from 5 mg/kg PFHxS (absolute values previously reported36). n = 13–15 (except control with n = 20). (f) Dam serum TSH at PD 22. n = 15–16. Data shown as mean + SEM. **p < 0.01 compared to control, ***p < 0.001 compared to control, ++p < 0.01 for full model comparison of indicated dose of PFHxS compared to no PFHxS exposure in the control and EDmix group. +++p < 0.001 for full model comparison of indicated dose of PFHxS compared to no PFHxS exposure in the control and EDmix group. ED: EDmix. Px: PFHxS. PD: postnatal day. TSH: Thyroid stimulating hormone. T3: Tri-iodothyronine, N/A: not available.

