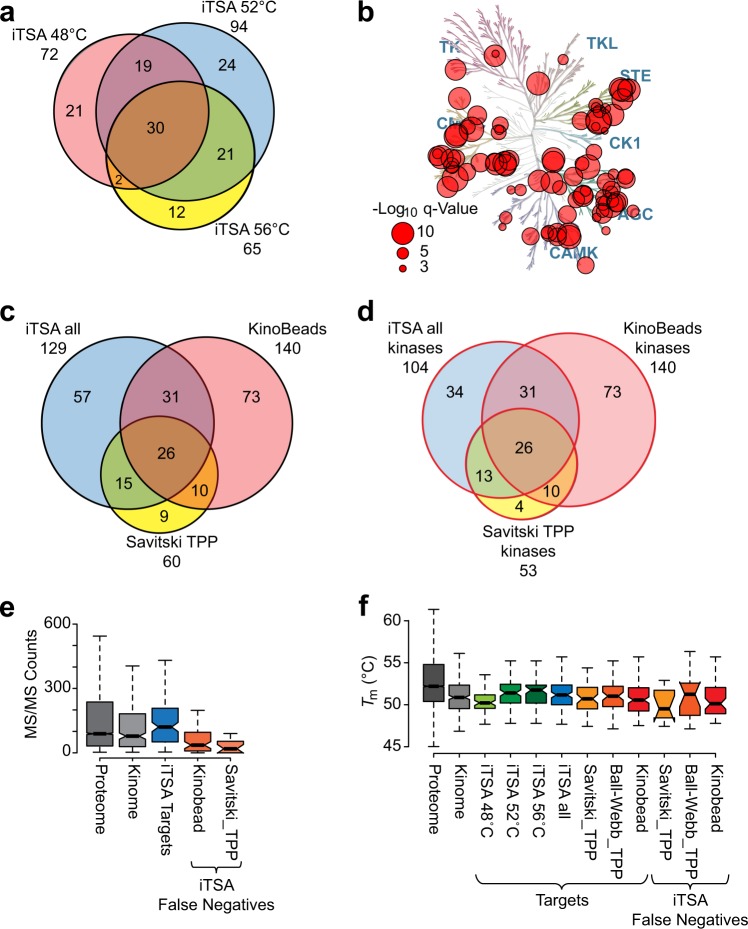
Fig. 2. Evaluation of the isothermal shift assay (iTSA) method targets.
a Overlap of staurosporine targets from 48 °C, 52 °C, and 56 °C iTSA experiments. b Kinome tree displaying all iTSA staurosporine kinase targets. Circle size is proportional to the −log10 q-value maximum from 48 °C, 52 °C, or 56 °C. c Venn diagram of iTSA targets (from all three iTSA experiments) overlap with previous staurosporine target assays. d Venn diagram of iTSA targets (from all three iTSA experiments) overlap with previous staurosporine target assays showing only kinase annotated proteins. e, f The distributions of MS/MS count and melting temperature (Tm) for the iTSA targets (FDR < 0.001) were compared to the indicated groups using box-and-whisker plots, as defined in Fig. 1b (boxplot statistics in Supplementary Data 1: boxplot.stats). Kinome tree illustrations reproduced courtesy of Cell Signaling Technology, Inc.

