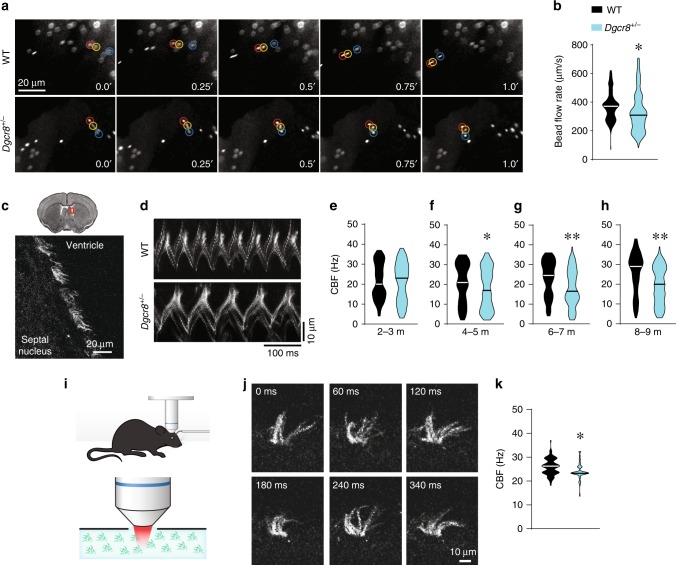
Fig. 2. Dgcr8 haploinsufficiency slows ependymal ciliary beating.
a Images of fluorescent beads at consecutive time points, which are shown in seconds. b The average bead speed is an indicator of the ependymal flow rate in 8-month-old whole mounts from WT (439 beads, 6 mice) and Dgcr8+/− (450 beads, 6 mice) animals. Data were analyzed using the Mann–Whitney rank-sum test (U = 72837, *p < 0.001). c A coronal section of the brain (top) with the magnified region of the LV wall (bottom) in Arl13beGFP mice. Motile cilia were labeled with eGFP and depicted in grayscale mode. d Kymographs of cilia beating, which was measured ex vivo brain slices from WT (Dgcr8+/+;Arl13beGFP) and Dgcr8+/− (Dgcr8+/−;Arl13beGFP) mice. e–h Ciliary beating frequency (CBF) in ex vivo brain slices from WT and Dgcr8+/− mice at 2–3 months (e), 4–5 months (f), 6–7 months (g), and 8–9 months (h) of age. In e, 82 ciliary bundles in 3 WT mice and 81 ciliary bundles in 3 Dgcr8+/− mice (U = 3227, p = 0.76) were assessed. In f, 132 ciliary bundles in 5 WT mice and 143 ciliary bundles in 5 Dgcr8+/− mice (U = 8037, *p < 0.05) were assessed. In g, 120 ciliary bundles in 4 WT mice and 112 ciliary bundles in 4 Dgcr8+/− mice (U = 4709, **p < 0.001) were assessed. In h, 145 ciliary bundles in 5 WT mice and 159 ciliary bundles in 5 Dgcr8+/− mice (U = 7116, **p < 0.001) were assessed (Mann-Whitney rank-sum test). i Experimental schematics for imaging ependymal CBF in vivo in an anesthetized mouse. j Representative images of motile cilia in the LV wall of an anesthetized mouse at consecutive time points. k Average CBF measured in vivo in WT and Dgcr8+/− mice (98 ciliary bundles in 3 WT mice, 88 ciliary bundles in 5 Dgcr8+/− mice; Mann–Whitney rank-sum test; U = 2509, *p < 0.001). Source data are provided as a Source Data file.

