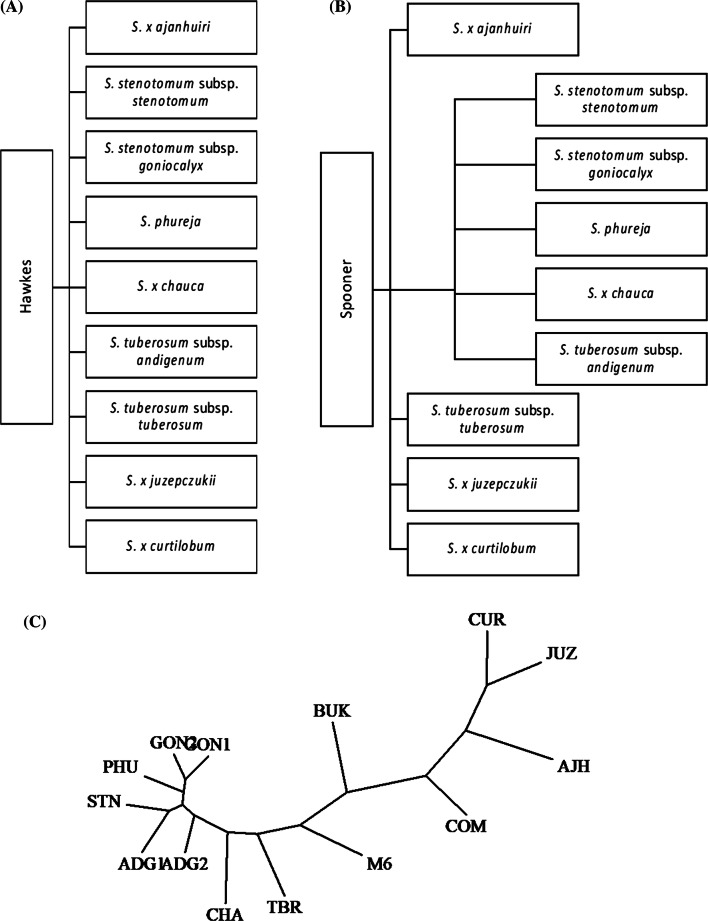
Fig. 4.
Species taxonomy based on a Hawkes (1990) and b Spooner et al. (2007) classifications. c The phylogenetic tree based on the CNV status of the genes (this study, the same data as used for the PCA). Similar to the PCA plot, CUR, JUZ and AJH genomes cluster closer and they cluster closer to the wild COM genome compared to the other genomes. Moreover, the other wild genome, BUK, is more distant than the other genomes. M6 and TBR genomes are close, while CHA is close to the GON1, GON2, PHU, STN ADG1 and ADG2 cluster

