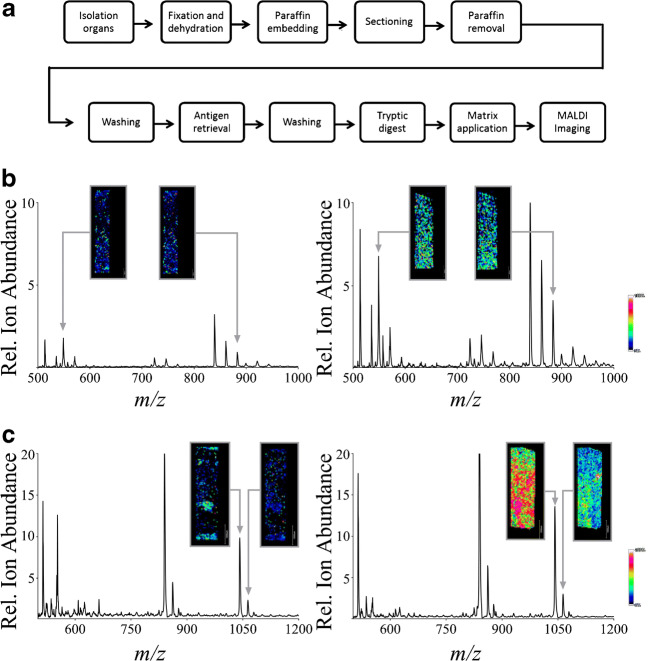
Fig. 1.
Optimizing an SOP for the MALDI MSI analysis of FFPE samples and the effect of trypsin manufacturers and solvents on MALDI MSI data. a Schematic representation of process steps optimized for MALDI MSI imaging of FFPE samples. b The effect of solvents for dissolving trypsin on MALDI MSI spectra. Shown are characteristic MALDI MSI spectra of mouse kidney samples when using 50 mM hydroxymethyl-aminomethane hydrochloride (left) vs. 20 mM ammonium bicarbonate (right) to dissolve trypsin from Sigma-Aldrich. c The effect of increasing concentrations of trypsin for enzymatic digestion of tissue proteins. Shown are characteristic MALDI MSI spectra using a trypsin concentration of 5 nM (left) vs. 50 nM (right). *)Grid size 50 μm each

