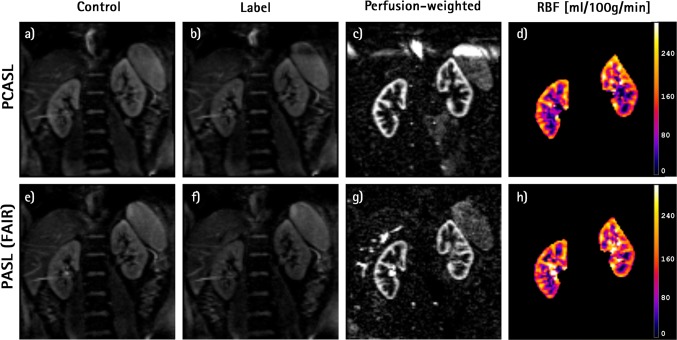
Fig. 4.
Example of renal ASL data from a healthy volunteer acquired at 3 T using the recommended protocol. Top row images were obtained with PCASL and bottom row with PASL (FAIR) labeling: a, e control; b, f label; c, g mean perfusion-weighted image; d, h RBF map. Data were acquired using background suppression (3 pulses), followed by a SE-EPI readout

