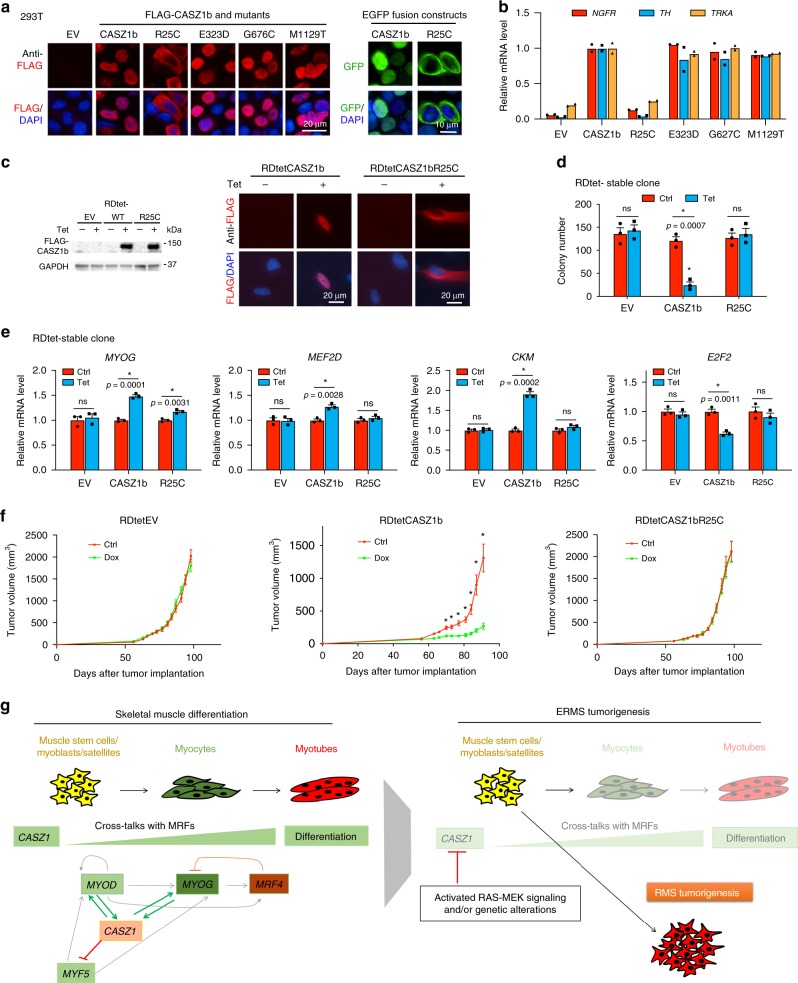
Fig. 7. Identification of loss of function SNV in CASZ1 gene.
a Immuno-staining of HEK293T cells transiently transfected with FLAG-CASZ1b and FLAG tagged constructs of RMS SNVs using anti-FLAG antibody (red) and DAPI (blue) shows that wild-type CASZ1b and CASZ1b RMS SNVs E323D, G676C, M1129T localize to the nucleus of HEK293T cells, but CASZ1bR25C localizes to the cytosol (left panel). EGFP signal (green) and DAPI (blue) staining show that CASZ1b-EGFP fusion protein localizes to nuclei and while RMS SNV CASZ1bR25C-EGFP localizes to the cytoplasm (right panel). b CASZ1bR25C but none of the other RMS SNVs has decreased transcriptional activity compared to wild-type CASZ1b. c Western blots show the induction of wild-type CASZ1b and CASZ1bR25C in tetracycline inducible RDtetCASZ1b and RDtetCASZ1bR25C cells (left panel); immuno-staining of RDtetCASZ1b and RDtetCASZ1bR25C cells using anti-FLAG antibody (red) and DAPI (blue) indicates that CASZ1b localizes to the nucleus (DAPI, blue) but CASZ1bR25C localizes to the cytosol (right panel). d Restoration of wild-type CASZ1b but not mutant -R25C in RD cells (Tet) significantly suppresses soft-agar colony formation compared to controls. e Restoration of wild-type CASZ1b but not mutant R25C in RD cells significantly upregulates MYOG, MEF2D, CKM and represses E2F2. f Dox alone has no effect on tumor growth in empty vector (EV) transfected RD cells generated xenografts (left panel). Restoration of CASZ1b in RD cells (Dox, middle panel) significantly suppresses tumor growth in xenografts compared to controls. Restoration of CASZ1b R25C mutant in RD cells (Dox, right panel) does not affect tumor growth in xenografts compared to Ctrl. g Schematic diagram shows that CASZ1 regulates skeletal muscle differentiation via forming a feed-forward loop with MYOD and MYOG (left panel), while inactivation of CASZ1 due to activated RAS-MEK signaling or genetic alteration disrupts this feed-forward loop and results in ERMS tumorigenesis (right panel). Data represent mean, n = 2 biological replicates for b, data represent mean ± SEM, n = 3 biological replicates for d, n = 10 mice/group, *p < 0.01 for f, ns not significant. Two-sided Student’s t-test was used to calculate statistical difference. Source data are provided as a Source Data file.

