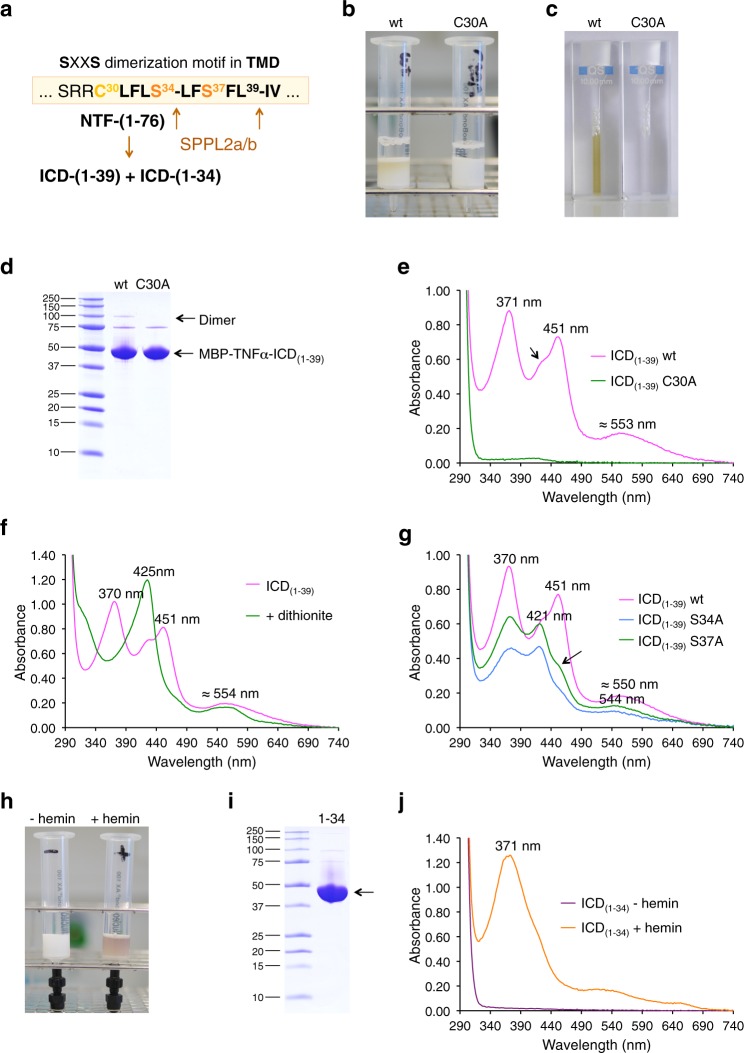
Fig. 3. Heme binding of ICDs generated by intramembrane cleavage of TNFα-NTF by SPPL2a/b.
a Cleavage sites of SPPL2a/b within the TMD of TNFα-NTF(1–76) and the putative SXXS TMD-dimerization motif. b Purification of MBP-TNFα-ICD(1–39) proteins (wt and C30A mutant) by amylose chromatography (all proteins shown in Fig. 3b–g were purified from the membrane fraction using Triton X-100). c Purified wt but not mutant C30A MBP-TNFα-ICD(1–39) is a yellow-green protein. d Purification of wt and mutant C30A MBP-TNFα-ICD(1–39) proteins was followed by SDS-PAGE. e UV/VIS spectroscopy of purified wt (magenta trace) and mutant C30A (green) MBP-TNFα-ICD(1–39) proteins. The split Soret band with absorbance maxima at 371 and 451 nm indicates bis-thiolate ligation of ferric heme. The arrow indicates a shoulder at about 420–425 nm in the absorption spectrum of ICD(1–39), which results from high-molecular weight protein clusters (see Supplementary Fig. 3d). f Dithionite reduction of ferric heme (magenta trace) to ferrous heme (green trace) converted the split Soret band of MBP-TNFα-ICD(1–39) to a single Soret band with an absorbance maximum at 425 nm. g UV/VIS spectroscopy of purified MBP-TNFα-ICD(1–39) wt (magenta trace) and mutants S34A (blue trace) and S37A (green trace). h Purification and reconstitution of MBP-TNFα-ICD(1–34). Cytosolic protein solutions of malE-TNFα-ICD-(1–34)-expressing E. coli cells were either directly applied to amylose affinity chromatography (−hemin) or reconstituted with 50 µM hemin (+hemin) before amylose affinity chromatography. i Purified MBP-TNFα−ICD(1–34) was analyzed by SDS-PAGE. j UV/VIS spectra of MBP-TNFα-ICD(1–34) (violet trace) and hemin-reconstituted MBP-TNFα-ICD(1–34) (orange trace). MBP-TNFα-ICD(1–39) wt was purified at least ten times (using different conditions: for purification from the membrane fraction using Triton X-100 and DDM as detergents, from the cytoplasmic fraction without detergent). In all cases split Soret spectra were observed, figures e–g show UV/Vis spectra of MBP-TNFα-ICD(1–39) wt from three different purifications. Purification and characterization of mutant MBP-TNFα-ICD(1–39) S34A and S37A proteins were repeated (including the detailed analysis shown in Supplementary Fig. 6) and representative results are shown. h–j Hemin reconstitution of MBP-TNFα-ICD(1–34) was done once.

