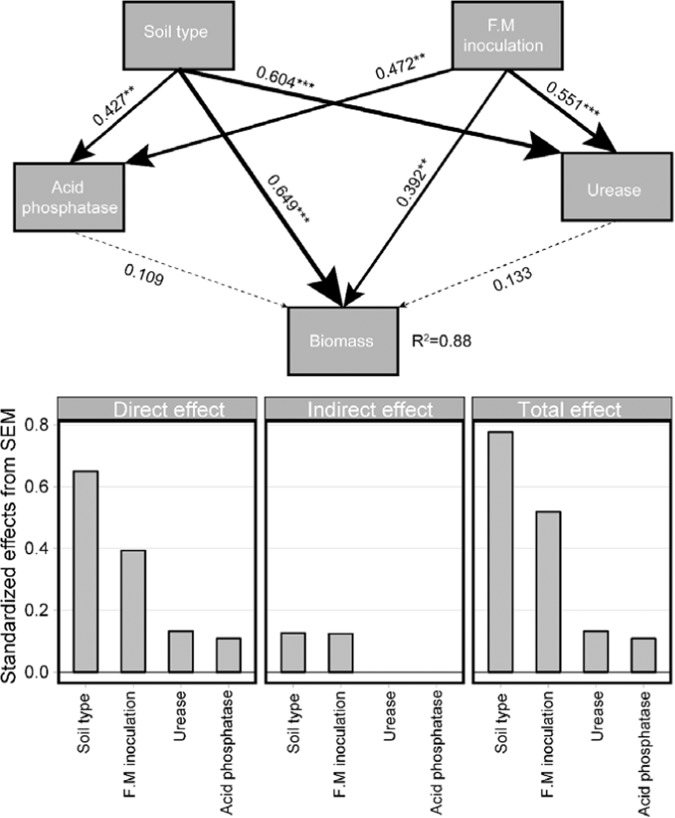
Figure 4.
A structural equation model showing the direct and indirect effects of soil type, treatment, acid phosphatase, and urease on the plant biomass. Solid and dashed arrows indicate significant and nonsignificant relationships, respectively. The width of the arrows is proportional to the strength of the path. R2 denotes the proportion of variance. Standardized effects (total, direct, and indirect effects) are derived from the structural equation model. The hypothetical model fits our data well: χ2 = 1.37, P = 0.50, df = 2, GFI = 0.98, and RMSEA = 0.00.

