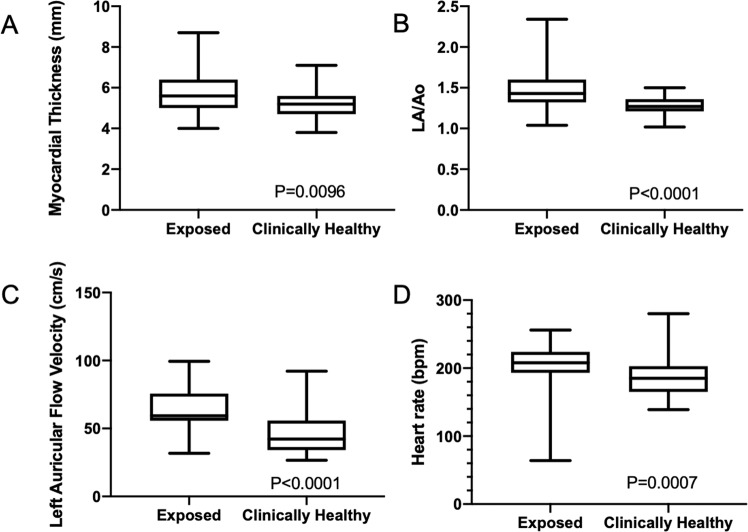
Figure 5.
Box and whisker plots depicting comparison of data between clinically healthy population (n = 35) and wildfire-exposed population (n = 51). The box represents the interquartile range with the horizontal line representing the median. The whiskers extend to the minimum and maximum values. The myocardial thickness (A) and left atrial to aortic root ratio (LA/Ao) (B) were significantly elevated in the wildfire-exposed population. The heart rate (C) and left auricular flow velocity (D) were also significantly elevated in the affected population, likely consistent with an increased output state following burn injury.

