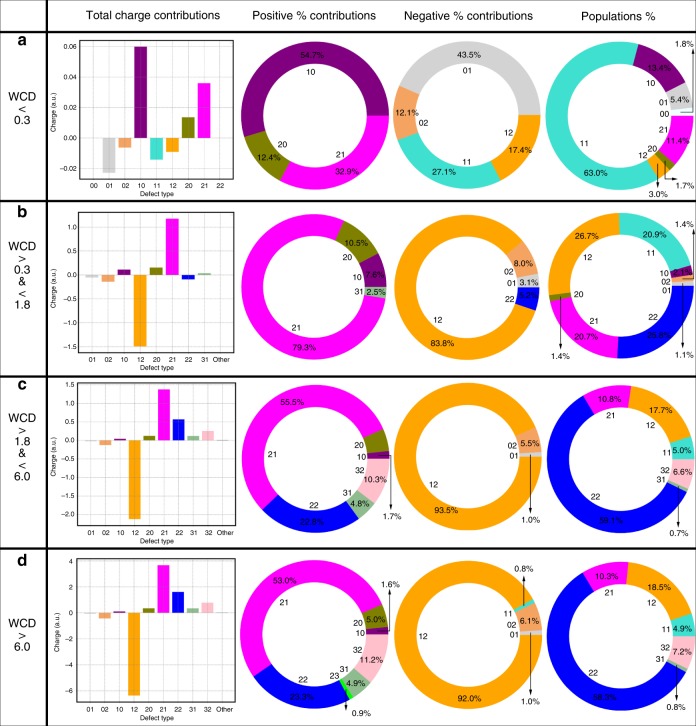
Fig. 3. Water/air layer-by-layer charge and population contributions.
Analysis of the water–air interface layer-by-layer (as defined in the main text) in terms of the average total charge contribution, percentage contribution to the positive charge, percentage contribution to the negative charge and percentage contribution to the overall population for each water coordination configuration. a reports the different contributions for the first layer, b for the second layer, c for the third layer and d for the fourth one.

